Just when you think you’ve got Facebook figured out, it rolls out another change. Last week, Facebook unveiled the new Insights platform, Facebook’s analytics tool for fan pages. While you may be unsure about some of the other recent changes, this change is a cause for celebration – a definite step forward for fan page analytics.
So what do you need to know about the new Insights? Here’s the 4-1-1 on the new metrics and how to use them.
- Friends of Fans: Like the name suggests, “Friends of Fans” is the number of unique people who are friends with your fans. The metric excludes anyone who is already a fan of your page.
Why it matters: Social media is social! Facebook’s data (and psychology) tells us that people are more likely to do something on Facebook if their friend has also done it. That means a person is more likely check out a link if their friend posted it or shared it with them. They are also more likely to like a fan page if their friend has already liked the page. And they are more likely to respond to a Facebook ad if it says their friend has liked the ad (or the page being advertised).
So although you may only have 5,000 “likes,” those 5,000 people could easily have a combined 1 million or more friends. Meaning those 1 million people have a chance to see your page’s content if their friend likes or comments on it (which creates a story) or “shares” it.
Before, to get this metric you had to pretend to create a Facebook ad targeting “friends of fans.” Now, it’s readily available and serves as a great reminder that you should be creating content that encourages your fans to engage with your page.
- People Talking About This: The new “People Talking About This” metric measures how many people have created a story about your page. Stories are created when someone likes your page, posts on your page’s wall, likes, comments, or shares a page post, answers a Question, RSVP’s to an event, mentions your page (by tagging it), checks-in to your place (if your page is a physical location, like a zoo), recommends your page, or tags your page in a photo.
Why it matters: Before, the best measure you had of activity outside your page was a messy compilation of likes and comments and page activity (wall posts, mentions, etc). But those weren’t all encompassing and left out several important activities, such as post shares, Questions, and event RSVP’s. And they really didn’t tell you exactly how much of that interaction with your page was being reflected outside of your fan page for others to see (through stories). That’s exactly what this new “People Talking About This” metric does.
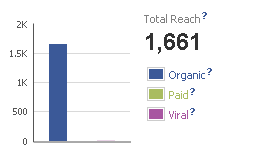
- Weekly Total Reach: “Weekly Total Reach” measures the number of unique individuals who have seen content related to your page, whether through a story or through an ad.
Why it matters: Ever wondered how many people actually see content associated with your page?Good news – you’re now one step closer. Of course, there’s no way to tell whether or not they have actually truly seen the content with their own eyes – but this means that the content has at least appeared while they were browsing Facebook that week.
- Per Post Data: One of the biggest changes to Insights is the way page post data is displayed. Before, you only had access to how many people had liked or commented on your post and how many impressions the post had received. Now, you can dig down to get a more accurate idea of your content’s performance!The interface is also much improved, allowing you to see as many posts at once as you need to. Even better – you can now export all of your post-level data to Excel!
- Reach: Reach tracks the number of unique people who have seen that particular post. If you click on the metric, it expands to show you what portion of those were organic (saw the post in their news feed, ticker, or on your page), viral (unique people who saw the post due to a story published by a friend as the result of liking, commenting on, or sharing the post, answering a Question, or RSVP’ing to an event), or paid (as a result of an ad).

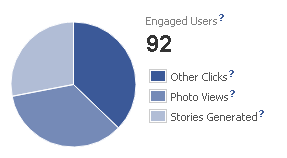
- Engaged Users: This is a measure of the number of people who have clicked on your post. By clicking on the metric, you can break it down into “Link Clicks” (clicks on the link included in your post or on the hyperlink to a video), “Stories Generated” (includes liking, commenting on or sharing a post, answering a Question, or event RSVPs), and “Other Clicks” (such as clicks on people’s names).

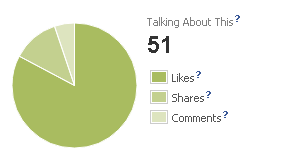
- Talking About This: Similar to the overall “People Talking About This” metric, this measures how many people are talking about the individual post. By clicking on the metric, you can see a breakdown by shares, comments, and likes.

- Virality: Way to make up a new word, Facebook! Virality is the number of unique individuals who have created a story from your post divided by the number of unique people who saw the post. A replacement for feedback percentage, (likes and comments divided by impressions), Virality goes one step further, allowing you to measure more than just simple likes and comments.
- Reach: Reach tracks the number of unique people who have seen that particular post. If you click on the metric, it expands to show you what portion of those were organic (saw the post in their news feed, ticker, or on your page), viral (unique people who saw the post due to a story published by a friend as the result of liking, commenting on, or sharing the post, answering a Question, or RSVP’ing to an event), or paid (as a result of an ad).
Why it matters: Unlike before, the new post-level data isn’t just restricted to likes and comments. It gives organizations a much more comprehensive picture of their content’s performance, equipping them with the information necessary to better evaluate what content resonates with their audience. Moving forward, organizations can also use the new data to better identify trends for their own audience. For example: Is there a certain time of day or day of the week that leads to more shares? Do more people click through on a link after work or on the weekends than they do during work hours?
Looking for the new Insights? It’s located on your tab panel, on the left of your fan page. For now, you can also still access the old Insights as well. Just click on “View old Insights” in the Admin box on the top right of your fan page.

Couple Questions for the FB Insights guru…
I use FB Insights quite a bit, however, I have had some trouble understanding the delta between many of my insights. For example, in the Key Metrics tab my Daily Organic Reach has a delta of 32 when compared to Daily Reach of Page Posts. What is not included in Daily Organic Reach that is included in Daily Reach of Page Posts? Shouldn’t they be the same? Is it possible that I am reaching the same person organically and virally?