
There is something about a number you can’t help but love — a number is clean, solid, magnificent, honest, like a giant statue of George Washington sculpted from Ivory soap.
That’s why as soon as the ink was dry on the M+R Benchmarks Study, we started craving MORE NUMBERS, and went to work slicing and dicing the data even further.
We delved into fundraising message results provided by 11 Benchmarks participants, with a special emphasis on the difference between previous donors and subscribers who have not made that first online gift (yet!) Here’s what we found*:
Past Donors Donate More
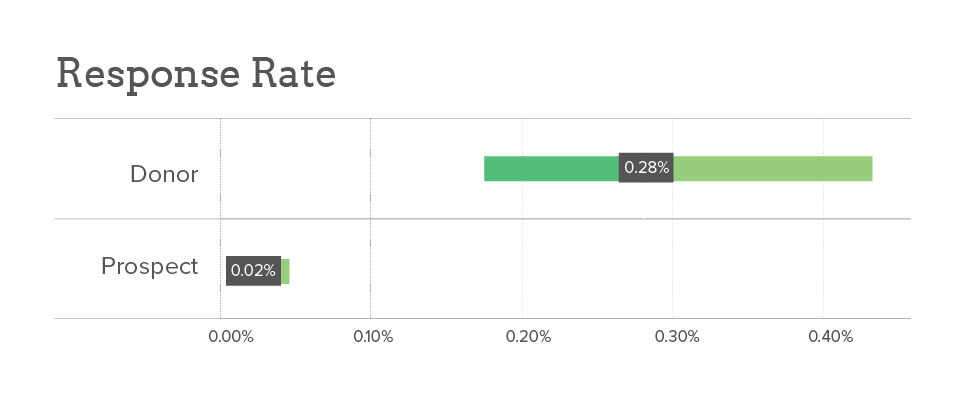
Not a huge shock: supporters who have donated before are more likely to give in response to a fundraising appeal. But the magnitude of the difference might surprise you. For the organizations in this analysis, the average donor response rate for 2015 one-time fundraising appeals was 12.5 times greater than the average non-donor response rate.
Page Conversion Matters Most
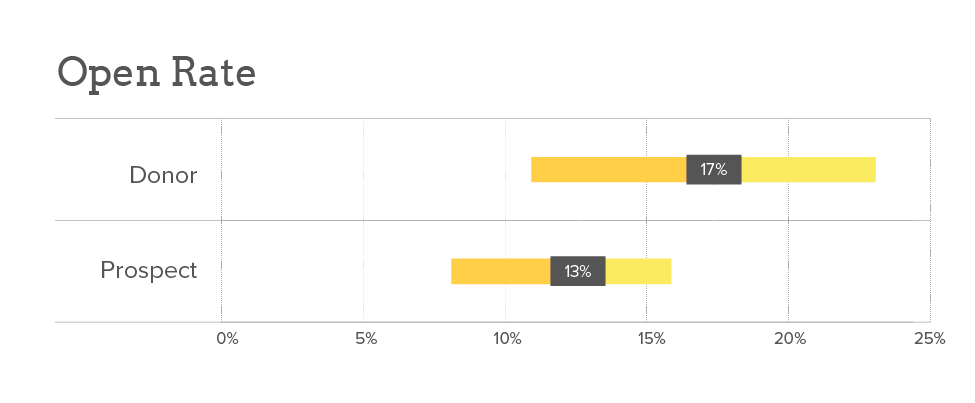
We looked at donor/non-donor breakdowns for three main contributors to response rate: open rate, click-through rate, and page conversion rate.
Open rate: The median open rate for donors was 1.4 times higher than for non-donors. Yes, donors are more engaged at the open stage, but not by much.
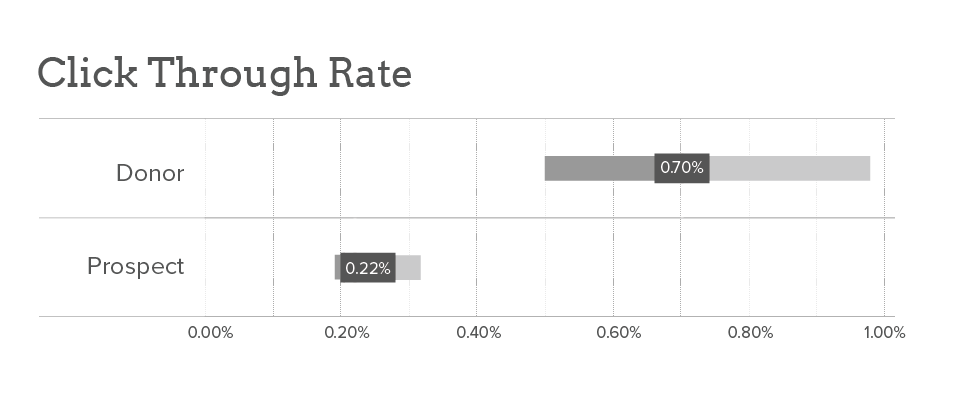
 Click-through rate: Donors had a click-through rate that was 3.2 times greater than non-donors.
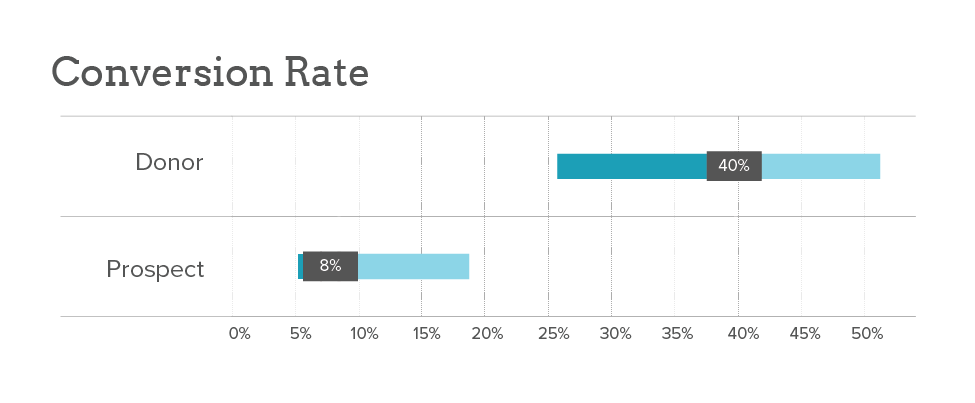
Donation page conversion rate: The biggest disparity between the two groups was in page conversion rate. After they clicked through to the donation page, the average donor was 4.7 times more likely to finish their gift than the average non-donor.
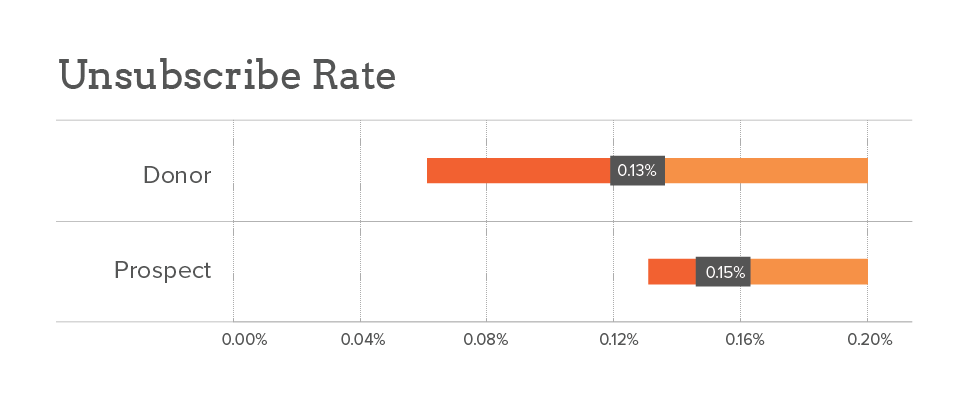
Donors Unsubscribe Less (Mostly)
Finally, we compared unsubscribe rates between these two segments. The median donor unsubscribe rate was0.8 times that ofthe rate for non-donors, meaning that for most groups, donors are less likely to unsubscribe than non-donors. This figure varied widely, though, with about a third of the organizations seeing the opposite – more unsubscribes per recipient for donors than for non-donors.
The Big Picture
It comes as no great surprise that donors are more responsive across the board than non-donors. They open, click, complete donation pages, and (most importantly!) donate at a higher rate than supporters with no past giving history.
But it’s incredibly useful to be able to quantify the sheer size of the difference. Even better, we now know that the biggest driver of that difference in response rates is at the page conversion stage – once a supporter has clicked “donate” but before they hit that final “submit” button. This means that the biggest source of growth potential for non-donors may be in streamlining and otherwise optimizing the prospect donation form experience. Good fodder for testing!
*Three things to keep in mind as you review these results:
1. While this post can be considered a postscript to our Benchmarks Study, the numbers cited here are drawn from a much smaller subset of organizations: 11 Benchmarks participants (all groups that we work with) that were able to provide data breaking down their message results by segment.
2. The only messages we considered for this analysis were one-time fundraising appeals; we did not look at advocacy, newsletter, or other messages, and we did not consider monthly giving appeals.
3. How to read the charts: The number shown in the gray box is the median value. The segment to the right of the gray box is the 75th percentile and the segment to the left is the 25th percentile.
Okay I get it, take me back up to the good stuff!
Donors are different: what the M+R Benchmarks Study can tell you about email list segmentation. #nptech https://t.co/BIWSnUfaQP
— M+R (@MRCampaigns) June 15, 2016