You don’t need to name your cat after a Doctor Who character or get an Atari tattoo, but when it comes to your online program, it pays to be nerdy.
Here are four super-important reports that we look at for our clients. If you want to run a data-driven online program, these are great places to start. You gotta know your numbers, people!
1. 24-Hour Email Results
You sent out an email telling your amazing supporters about your amazing work and asking them to do something simple (but amazing).
Did it actually work? Did it work better than the last one you sent?
To find out, sit on your hands for 24 hours, then pull the key metrics below and compare them side-by-side with similar emails you’ve sent in the past. For an apples-to-apples comparison, it’s important to consistently pull results about 24 hours after your email launched.
Frequency: Every time you send an email
Metrics: Open Rate, Click Through Rate (CTR), Response Rate, Unsubscribe Rate. [Optional: Number of Responses, Revenue, Average Gift, Conversion Rate, or any other metric important to your program]

Then be sure to do a final wrap-up report a week or two later, so you can capture the emails’ ultimate performance. Then — bonus! — see how you stack up against other organizations in the eNonprofit Benchmarks Study.
2. List Health
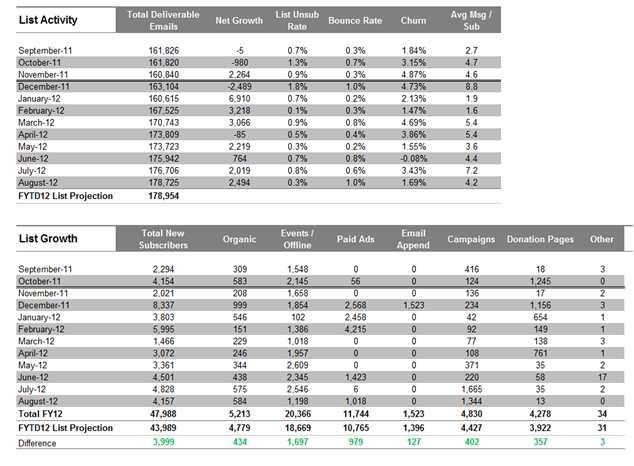
Just like people, lists need regular check-ups to make sure they stay healthy. So schedule regular check-ups for your list to make sure you don’t have too many emails bouncing or unsubscribing and that your list is growing at a steady pace. Whether you compare these metrics weekly, monthly, or quarterly, it is important to know how your list is changing (or not changing) over time.
Frequency: Most of the groups we work with review their list health each month, but some groups run weekly reports and some groups look at it every few months.
Metrics: Unsubscribes, Bounces, Spam Complaints, Number of New Sign-ups, Sources of New Sign-ups

3. Return on Investment Analysis
You experimented with banner ads this year. You paid a petition site to promote your actions. Maybe you built a Facebook app or launched a microsite that ended up getting a lot of people to sign up for your list.
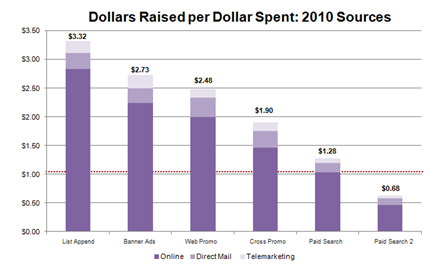
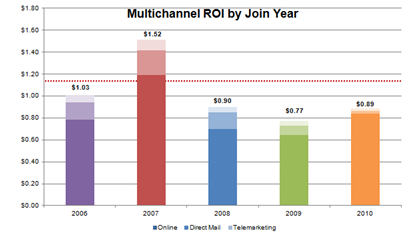
A return on investment (ROI) analysis will help you decide the best (and worst) places to spend your time and money getting new email subscribers in the future. Did that investment pay off right away… in a year… further down the road… not at all?
If you don’t do some kind of ROI analysis (that includes all income from the new recruits, across channels), you might never know that you’re dumping a portion of your budget down the toilet. Likewise, you might not realize that one particular source is a veritable goldmine of committed activists and donors.
Frequency: Groups looking to seriously invest in email acquisition should be doing this at least once a year.
Metrics: For each source of new email addresses: Dollars Raised per Dollar Spent (ROI), Cost to Acquire a New Donor, Number of Donors Acquired. There’s a lot you can look at in an ROI analysis – this is just a starting point!


4. Statistical Significance for Tests
Any online program worth its salt uses testing to optimize performance. But how do you make sure you’re declaring “winners” correctly? How do you know whether a bump in response rate is actionable or just a result of random noise in the data? By testing for statistical significance.
For metrics that count what proportion of people did something with your email (opened an email, clicked, took action, made a gift, etc), you should use a chi-squared test to be at least 95% confident any difference between your test and control version is due to the tactic you tested. There are various free chi-square calculators online. To test for statistical significance for average gift size (which, FYI, tends to require a pretty big performance gap between the test and control versions and a pretty large sample size), you’ll need to use a two sample t-test, which can be run right in Excel and other online calculators.
Frequency: Every time you run a test (which should be as often as you can!)
Metrics: Depends what you’re testing. In most of our email tests, we focus on improving our response rates – getting more people to take action and/or donate.


