
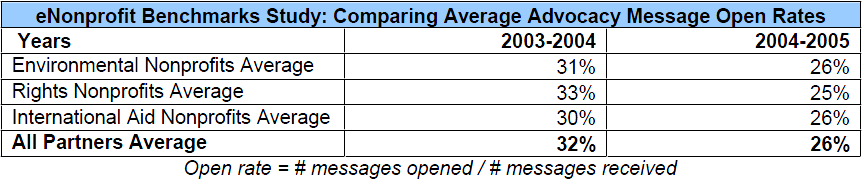
Open rates are dropping like flies. When we examined data from 15 national non-profit groups for the eNonprofit Benchmarks Study earlier this year we found a steady, striking decline in email open rates across all the groups over the past two years. Average open rates for the groups fell by 6% (see the table below for more detail).
This decline may sound like terrible news for any organization that communicates with its members, constituents, activists, or donors online but please don’t commit hara-kiri yet! Happily, we did not find a corresponding decline in page completion or response rates. At first glance, this discrepancy seems truly puzzling. Shouldn’t fewer people be responding to these emails if fewer people are opening them in the first place?
Some believe the recent drop in open rates is a result of “list fatigue” – what happens when formerly enthusiastic supporters become overwhelmed by the sheer volume of email in their inboxes and no longer rush to open and respond to email calls to action, requests for money, or event invitations. Although the fear of “list fatigue” may haunt online organizers, fundraisers, and marketers, it cannot explain away the discrepancy between open rates and response rates. If people are too tired, overwhelmed or unmotivated to open an email message, they’re certainly not going to take action, donate money, or reply to it. Clearly something else is to blame.
Could Image Blocking Be the Culprit?
Is it possible that just as many people are opening emails today as were opening them two years ago but that not all of them are being counted? The most compelling explanation for both the decline in open rates and the discrepancy between open and response rates is that new image-blocking software is interfering with open rate tracking and causing open rates to be significantly under-reported.
In response to the rise of spam in recent years, many email providers have implemented new systems that allow users to read the text of an email while blocking all the images in the message. Image blocking is now used by Gmail, Microsoft Outlook 2003, and AOL 9.0. In fact, the default for both Outlook 2003 and Gmail is to block all images, automatically eliminating images for anyone who is not tech-savvy enough to change the default setting.
Open rates are tracked using a very small (one pixel) image embedded in the body of the email message which this new image-blocking technology prevents from loading and being counted by the tracking software. Therefore, image blocking is causing the number of email messages actually opened to be underreported. (For more information about the pros and cons of including images in your email messages, click here.)
The Detective Work Begins
To determine the impact of image blocking on open rates and to gauge how accurately open rates currently represent the effectiveness of an organization’s online communications, we conducted an in-depth analysis using messaging data from three major national nonprofit organizations: Human Rights First, The Planned Parenthood Federation of America, and The Wilderness Society.
We examined three messages from each organization – two email advocacy messages and one online fundraising appeal – that had been sent to the organization’s full (or nearly full) email list between April and June of 2006. Analyzing the data from each message enabled us to determine how many of the recipients who had clicked on a link in that specific message were actually tracked as having opened that specific message.
Mystery Solved!
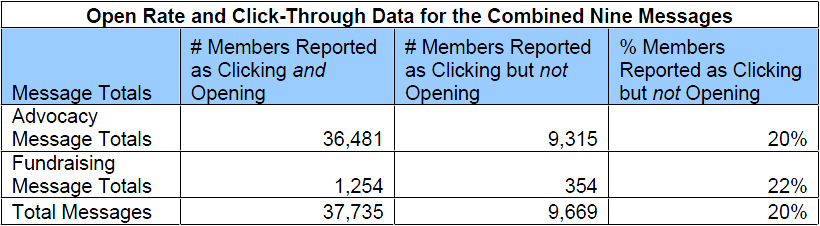
The data from these nine messages revealed that an astounding 20% of the people who had clicked on a link were not reported as having opened the message.
If 20% of the members who clicked on a link in the email were not counted as having opened the message, what does that imply about the people who open and read an email (without downloading any of the images) but who never click on a link?
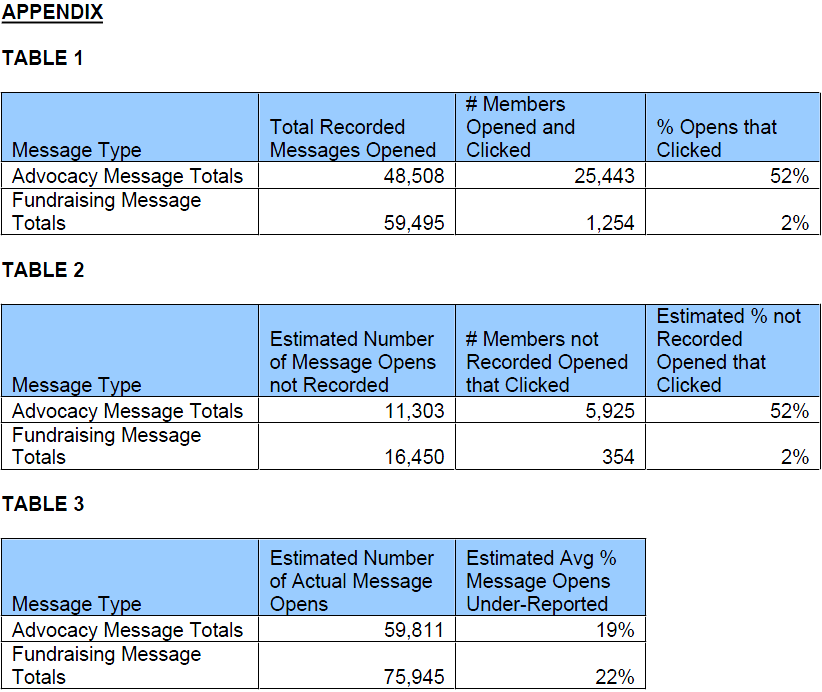
On average, we estimate that open rates are being under-reported by at least 20% for these three organizations (please see Tables 1-3 in the Appendix for more detail.) This may not be true of all organizations and may vary depending on the percentage of email providers specific to the make up an organization’s constituency base. For example, if a larger percentage of an organization’s email list uses Gmail, their open rates may be lower than an organization whose list members use primarily Yahoo and Hotmail.
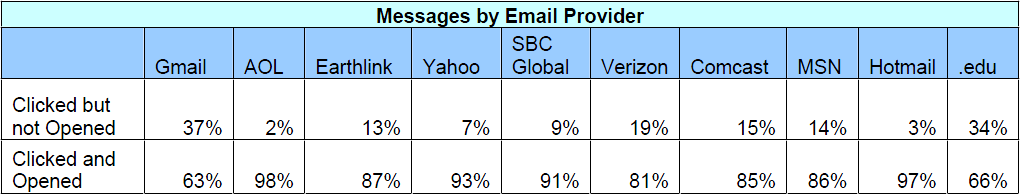
To test out this theory, we examined the combined messaging data by email provider. As you can see below, Gmail led the pack in the percentage of click-throughs that were not reported as having opened the emails. A whopping 37% of the clicks coming from Gmail users were not reported as having opened the email message. Emails with the .edu extension also seemed to have an unusually high percentage of click-throughs that were not reported as opens. Also note that only 2% of the clicks from AOL were not reported in the number of messages opened. This may be because this study only looked at all people with an AOL address extension, many of whom may be using older versions of AOL (anything earlier than 9.0) that do not automatically block images. Another reason why these AOL users do not exhibit a significant discrepancy between open and click-through or response rates is that GetActive, the email messaging vendor for many of the study participants, is whitelisted with AOL. If the sending email service provider is from a trusted sender on AOL’s enhanced whitelist, (as GetActive is) AOL overrides the image blocking default setting for users of 9.0 and above. Although end users can still set image blocking locally for AOL-whitelisted senders, few do.
What Does This Mean for You?
No matter how you cut the data, open rates are a flawed statistic. In addition to the significant under-reporting caused by image blocking, open rates have another much better-known limitation – the “plain text problem.” Because opens are tracked through the loading of a one-pixel image in the body of a recipient’s email, open rates can track only the HTML versions of a message. The exclusion of the plain text versions of the message makes open rates inherently limited and incomplete.
While we’re not suggesting that you stop looking at open rates altogether, there are more reliable statistics that can provide a more accurate picture of your online communications. For example, if the email in question includes links, why not look at click-through rates? Click-through data tells us even more than an open rate can. When comparing messages A and B for example, you may see that message A has a higher click-through rate, but a lower open rate, than message B. Given that open rates are not always accurate, you’ll know to pay more attention to the click-through rate.
Response rates are also far more telling than open rates. The ultimate goal of a fundraising or advocacy email is to motivate the recipients to take action or make a donation, so the response rates will better reflect how effective the message was.
What Are Open Rates Good For?
Despite their limitations, open rates can be useful as a comparative statistic. For instance, open rates can help you determine which of two or more mailings sent in the same rough time period was more successful. Open rates are also very useful for determining which subject line will be the most effective — you can test several subject lines with identical copies of the message on small, randomly chosen segments of your audience to see which subject line produces the best results prior to sending out the full mailing with the winning subject line.
However, in both cases, we’d still suggest you consider the click-through and response rates for each version of the message in making your decision about which subject line to use. It’s possible that one subject line might provoke a higher open rate but result in less click-throughs and, therefore, less actions or donations or sign ups.
In the case that you send out an email message that does not include any links at all, such as a reminder, update or enewsletter, open rates can provide you with some limited information about the performance of your message. Overall, we’d recommend that you keep the limitations we’ve outlined above in mind when reviewing open rates. No need to abandon them so long as you take them with a grain of salt!
METHODOLOGY
Two data exports were made for each message analyzed. One export included all of the members that were sent the email, opened the email, and clicked on the main link in the email. The other export consisted of all of the members that were sent the email, did not open the email, and clicked on the link. With the exception of the Human Rights First members, members who request to receive plain text emails were not counted in the analysis. Human Rights First had less that a half of a percent receiving plain text email, so the extra step to exclude them was not necessary.