
Champagne is for chumps. If you realllllly know how to party, you spend your New Year’s Eve hitting refresh refresh refresh on your online fundraising totals. Good times, people.
And…it WAS a good time this year! Mostly.
We aggregated results from 16 of our clients who were able to provide data from both 2013 and 2014, here’s what we found.
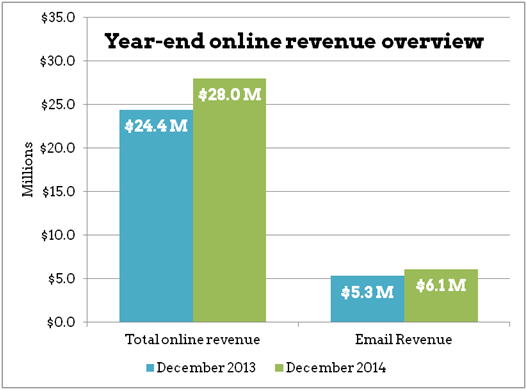
The big number got bigger: Online revenue was up at year-end. Of the 16 non-profits we were able to track over both years, 14 organizations raised more money online in December 2014 than they did in December 2013. Taken together, these groups raised $28.0 million this December, compared with $24.4 million last December — a 15% bump across the board.
Email also brought in more money, with 13 of 16 organizations seeing an increase in email-sourced revenue over last year. Email-driven revenue for these groups went up from $5.3 million last in December, 2013, to $6.1 million this December.
So email’s doing great, right? Well, sort of. Kind of not really. But also yes! It’s complicated.
None of the major email metrics we normally track showed a big improvement over 2013 numbers – in fact, most trended in the opposite direction. For example:
- Email response rates were down: More than half of our sample groups saw lower response rates than in 2013 – the average appeal’s response rate was down to 0.061% from 0.072% last year.
- Average gifts were lower: Of the 12 groups with average gift data for both years, two-thirds saw a drop in average gift year-over-year. The average change was pretty small – a drop of only 3% – which may be attributable at least in part to growing sustainer programs which tend to drive down average gift.
- List growth was inconsistent at best: This one was more of a wash, with nine of our 16 sample organizations sending to smaller lists than last year. We saw wide variation on this metric, with one smaller group more than quintupling in size while a large group shed over a million names due to suppressed inactives.
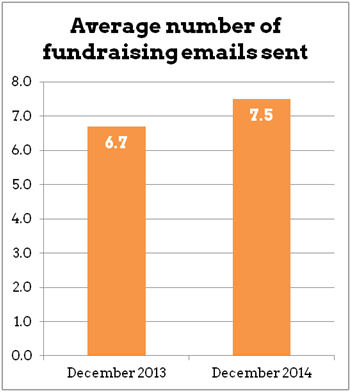
- We turned the volume UP: This is the one place we saw numbers up or steady almost across the board. All but two of the 16 groups in our sample either sent more email this December or held steady at the same volume. The average year-end email count was 7.5 this year, up from 6.7 in 2013.
What’s the bottom line on 2014 EOY email revenue? An increase in email appeal volume and more opportunities to give translated into more email revenue, overcoming some small declines in other metrics. In short: mo’ messages meant mo’ money (and as you know, mo’ money has been the subject of speculation by some scholars, who have found it to be correlated with mo’ problems, but that’s beyond the scope of our analysis here).
Okay, so maybe it’s not so complicated after all? No wait, it gets more complicated.
Because here’s the thing: your email subscribers don’t just give in response to email — they come to you from search and social, they go straight to your site, they do strange things like print up a donation page and then mail you a check. Rather than just drawing straight lines between emails going out and email revenue coming in, we should also be thinking in terms of a fuzzier, more tangled web of connections.
Say, for example, three people read an email appeal from your organization on their phones in line at Starbucks. Then what?
- One person makes a gift right then and there, hurrah! This gets tracked in our email metrics.
- Another heads to your homepage when she gets to the office and clicks the big red donate button she finds there.
- Yet another sees a retargeting ad the next day and clicks through to give.
Only one of these gifts will show up as “email” revenue, even if the email played a deciding role in all three. Unfortunately, it’s very tough to pin down exactly which point of contact triggers that decision to donate.
Here’s what we do know: of a small sample of seven organizations who provided data on this, we found that only about a third of the revenue donated by email listmembers was actually sourced directly to email. That means upwards of two-thirds of donations by email subscribers came in through other channels like passive web or search — even when email is motivating them to give.
That’s why it’s so important to make the case to donors as many ways as possible — search, retargeting, social media, mail, phone, carrier pigeon (where appropriate), and yes, email. Good, consistent messaging across multiple channels can make your strong email program that much stronger. All that adds up to more revenue on December 31 — and that, my friend, is something worth a champagne toast.