
When it comes to 2018 end-of-year digital fundraising results, we’ve heard it all. 2018 EOY was great! EOY was terrible! EOY was… kind of extremely meh?
Complicated answers lead to interesting questions. So we dug deep, unturned every rock in our data garden, surveyed our loyal Labs readers (hey, that’s you!), and compared year-over-year (-over-year over-year-over-year) stats to get a clear look at what actually happened in December.
More on that in a second, but first! We’re still exploring findings, and we have some BIG QUESTIONS to answer. Those are going to take time (and a whole lot of data) to answer—so we’ll be doing a special early Benchmarks preview(!!!), which will go live in February. Stay tuned!
Without further ado: The Big Picture
- For the 23 organizations where we collected year over year data, the median* group saw December revenue figures down 9% and email revenue down 18%. Another third of our sample stayed flat YOY, while only a few organizations saw substantial gains.
- Overall gift count was down 15%, and average gift size was down 3%, to $100—so not only were fewer people giving, they were also making (slightly) smaller gifts.
- Email volume didn’t really change (the first time we’ve seen this in our EOY review!). The median group in our sample sent 11 appeals, which was the same number as they sent in 2017. Could we have hit the saturation point? Should we lobby Congress to add more days to December?
- Deliverability, while still top of mind for most groups, didn’t seem to impact overall response patterns to email: the median group saw a response rate of 0.07%, which was identical to last year, while average gift from email was down 2% to $103.
- Direct return on ad spend (ROAS)—counting clickthrough revenue only—was positive overall, resulting in $1.08 in revenue for every dollar spend on ads, down 25% from last year. This was in large part due to increasing ad costs: Cost per 1000 impressions was up across channels, and groups were spending 25% more for 2% fewer eyeballs (ouch!).
- Even though EOY was a little womp womp for the average group, Giving Tuesday continues to grow: Revenue for this now-multi-day marketing blitz was up 16% from last year.
For you visual learners out there, we have some charts (we love our charts!):
December 31st: still the best and most nerve-wracking day of the year
This was what my inbox looked like for 39 minutes of December 31:
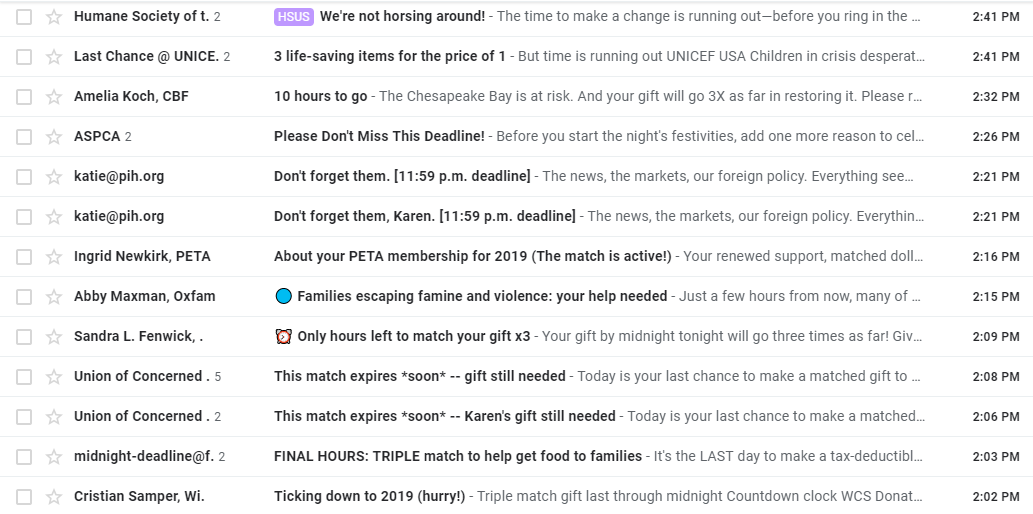
I could have chosen any 39-minute block that day, and it would look pretty much like this. True, I am a digital fundraiser and thus by definition not normal, so mine is surely an extreme case. But the fact remains: so much email is sent out in December, especially on the 31st. With that much volume, it’s tough to stand out from the crowd. Do all those DEADLINE DEADLINE LAST CHANCE emails, ads, and social posts have the same power they used to?
Sure looks like it: donors turned out in droves on the 31st to make that one last, final chance gift—at almost an identical rate as they did last year: 24% of all December revenue came in on December 31 alone, where 22% came in on December 31, 2017, and 22% came in on December 31, 2016. Maybe they know how much we love our white-knuckled attention to returns on that very last day?
One small reminder about math here: even though a larger proportion of overall revenue came in on December 31, like the rest of EOY, revenue for that single day was down 5% compared to the same day in 2017.
Inactives, be gone!
Even though organizations were sending the same number of emails, they were actually sending them to fewer people than in previous years—largely due to inactive suppressions in response to deliverability concerns. Average list size fell 13% year over year—and for some groups, that drop was much (much!) bigger.
We dug into the groups that saw their list size drop year-over-year and saw a surprising trend: these groups with shrinking list sizes saw a 26% improvement in response rate from 2017, which then translated to a 2% improvement in email revenue (remember when we said the average group saw an 18% decline?!).
Obviously, sending to more engaged users boosts your mailing stats, and now we have the proof: the data shows that cleaner lists raise more money and get emails in front of the eyeballs that want to read them. If you haven’t been thinking about your inactive suppression strategy, you’re officially in the minority—and your performance could be suffering. Catch up with advice from our deliverability doctor here!
Pay (more) to play
More groups are investing in ads, and those who have invested in previous years are generally spending more. All of the 23 groups for which we have year over year data invested in paid ads of some variety during December, up from 91% in 2017.
Direct return on ad spend (ROAS)—counting clickthrough revenue only—was positive overall, resulting in $1.08 in revenue for every dollar spend on ads, down 25% from last year. When we count view through revenue as well, ROAS comes up to $1.62.
Both of these metrics tell us that immediate investment provides an immediate return (not to mention the value of recruiting new donors)—but those investments aren’t going as far to get organizations face-time with potential donors. Year-over-year cost per 1,000 impressions (CPM) is up—way up, in some cases.
For the groups where we have comprehensive spend and impression data (there were 11 of them), overall spend on Social and Display went up 25% but overall impressions were down 2%. Drilling down a little more, cost per impressions (CPM) for Social was up 62%, and CPM for Display was up 10%. This means that even if organizations increased their ad budgets, chances are they were reaching the same number—or possibly even fewer—eyeballs than they were in previous years, and those dollars aren’t going as far.
Obviously, impression metrics don’t tell the whole story—especially when you’re trying to recruit donors. But when so many groups have told us anecdotally that they found ads to be more expensive and more difficult to place than in years past, we want the data to back up those feelings. #DataAnalystLife
#GivingTuesday: the light in the darkness
Everybody gets very excited about Giving Tuesday—the buildup, the special offers, the attention, the revenue. But the minute it’s over, everybody turns their focus to end of year…just when the most exciting part of Giving Tuesday begins: all the sweet data! Sometimes it honestly feels like the rest of the world is not as jazzed about data as I am.
So, if you can stretch your brain all the way back to November, we have a few trends that emerged after surveying 27 nonprofits with year-over-year data:
- Giving Tuesday volume is way (way way way!) up. People are sending more messages, running more ads, Tweeting, Facebooking, bugging their friends, and raising more money.
- About that money: the 25 groups that provided revenue totals raised $10 million dollars. 10. Million. Dollars. That’s up 16% from last year.
- Even more wildly… even though email volume was sky high relative to last year, response rate kept pace.
So as I was saying: On average, nonprofits increased online Giving Tuesday revenue by 16% over 2017 totals. And while a handful of the nonprofits we surveyed did see modest decreases year-over-year, especially international groups, others saw increases as large as 300%+.
Notably, international relief groups saw decreases anywhere between 4-23% from last year. As we try to assess what might be behind the lackluster performance for international relief orgs, it’s important to note that 2016 and 2017 were standout years for International groups. Crises that hit news cycles earlier in 2018 could have also fatigued their donor lists.
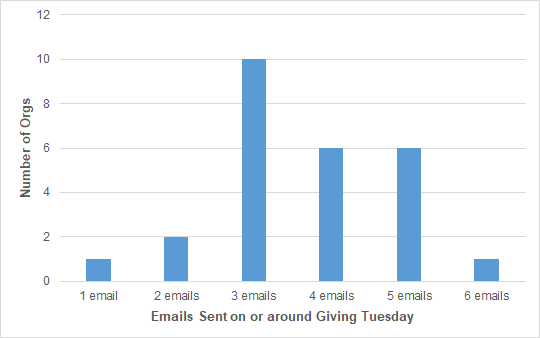
Part of the credit for these ever-increasing revenue totals is (seemingly) ever-increasing email volume: the nonprofits in our sample sent an average of three Giving Tuesday email messages this year, with the more ambitious among them sending as many as six appeals. And, just as with the holiday season and presidential elections, Giving Tuesday creep is a thing—more and more groups are starting their promotions early, with 58% of reporting organizations announcing their special offers and matching gifts one or more days before Tuesday.
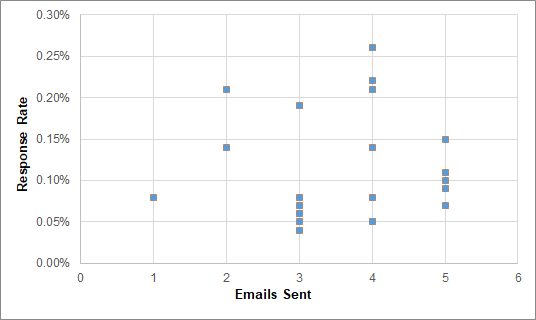
Email response rates to this plethora of emails were generally strong. Across the full set of GT appeals, none of the nonprofits we surveyed saw a response rate lower than the M+R Benchmark (0.06%). Several nonprofits recorded response rates typically only seen during emergencies or at the end-of-year deadline email (0.15%-0.26%).
Oh, and there was no evidence of a “correct” volume—we saw no correlation between the number of appeals sent and response rate.
So this begs the question: were donors just giving at Giving Tuesday and not at EOY? I know, I know—I’m supposed to be answering the questions, not asking more! But this is a toughie—especially with Giving Tuesday continuing to grow year after year (after year, after year!). Are we expanding our pool of donors or just getting them to give at different times?
What I do know is that when combined, Giving Tuesday and EOY totals remain down year over year, meaning that the increase in Giving Tuesday revenue was not enough to overcome weak EOY performance. We’re also going to be digging into giving patterns and retention for EOY donors as part of that Benchmarks preview next month.
But so like, what gives?
Giving Tuesday was pretty great. And then EOY was not so great. You’ve seen the numbers. We’ve seen the numbers. The more we dig, the more questions we have—and we hate having questions without answers. That’s why we’re not stopping here. That extra special Benchmarks preview will help us answer some of the bigger questions we raised earlier this month:
- Did the new tax law impact giving for any or all donor segments, particularly mid-level givers?
- Did political fatigue, wins, or changing issue focus impact giving (especially for politically-oriented organizations)?
- Did the increased focus on Giving Tuesday decrease December giving?
- Was 2017 such a strong online fundraising year for many organizations that 2018 was a return to “normal” for some or many groups?
- Did the recent turbulence in the stock market lead donors to be more conservative in their giving?
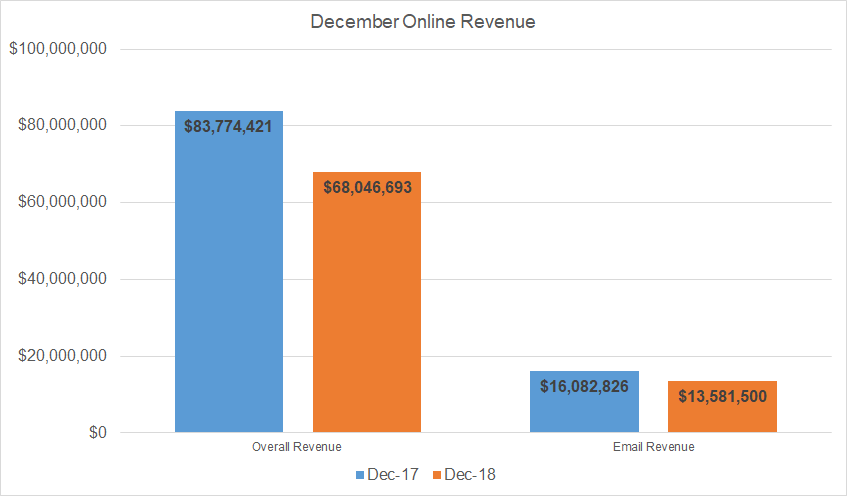
- Is email dead?
- OH WAIT I can answer this one now. Email is dead: 13.5 million dollars dead (see: December Online Revenue chart).
If you haven’t taken our survey yet, we’re still accepting responses! For those of you who have given us juicy numbers and thoughtful hypotheses, thank you! For anyone participating in Benchmarks: the sooner we get the completed data templates for your organization, the sooner we can crunch all the numbers and have some more answers for you. It really is a team effort—thank you!
* As with our annual Benchmarks Study, the average numbers we refer to in this post represent the median figure among surveyed nonprofits.