
 By Amy Peyrot
 In the 2017 Benchmarks report, we promised to turn it up to 11. And never has that been truer than in our social media section. This year we have more metrics than we ever have!
SIZE YOURSELF UP
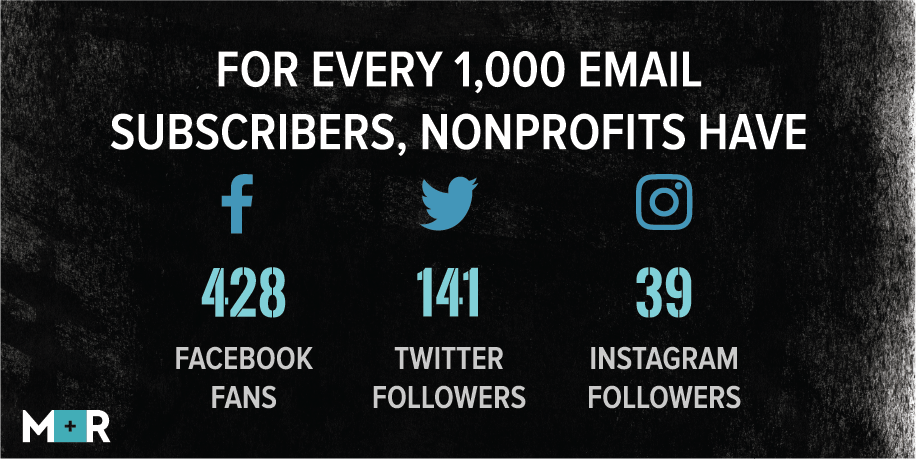
It’s easy to compare your public number of fans/follows to your peers, but doing so is dangerous. First of all, we’ll say it until the cows come home: the number of fans you have isn’t as important as what you do with them. Secondly, looking at numbers of fans or followers doesn’t take into account that some groups just have larger online presence than others. You can set realistic expectations for your Facebook, Twitter, and Instagram by comparing them to your email list size. Check out how this breaks down by sector:
HOW MUCH IS TOO MUCH?
Have you ever wondered if the number of times your group posts is too much or too little? According to our study, the average nonprofit posts 1.4 times a day on Facebook and 3.7 times a day on Twitter. However, this varies a bit by sector—for example, Wildlife and Animal Welfare groups are the most prolific with 1.7 posts per day on Facebook and 5.8 on Twitter (that’s 12 posts and 40 tweets per 7-day period). See how you stack up to your sector.
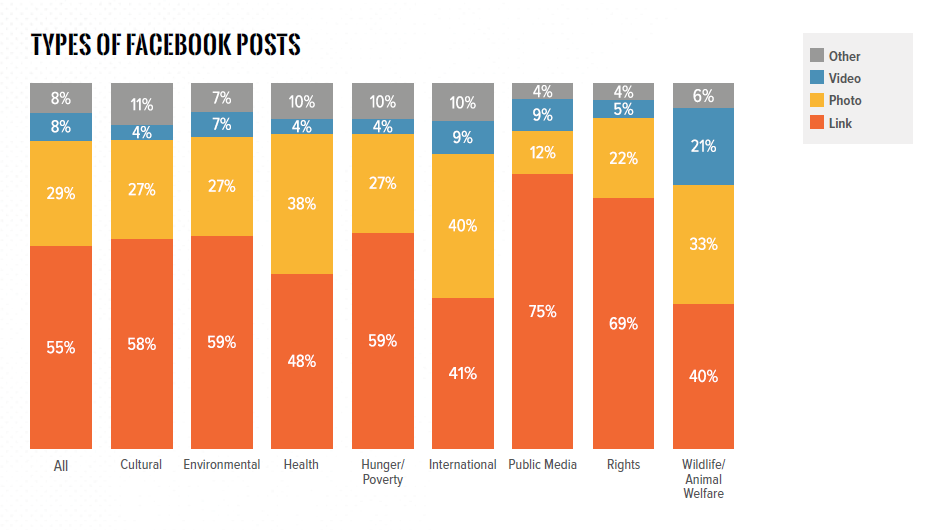
This year, for the first time ever, we also looked at what TYPE of content groups were posting on Facebook. For most groups, link posts are still more prominent than photo posts, but the share that each type of post makes up (photos, videos, links) varied by sector as well—see for yourself:
THERE’S A NEW METRIC IN TOWN…
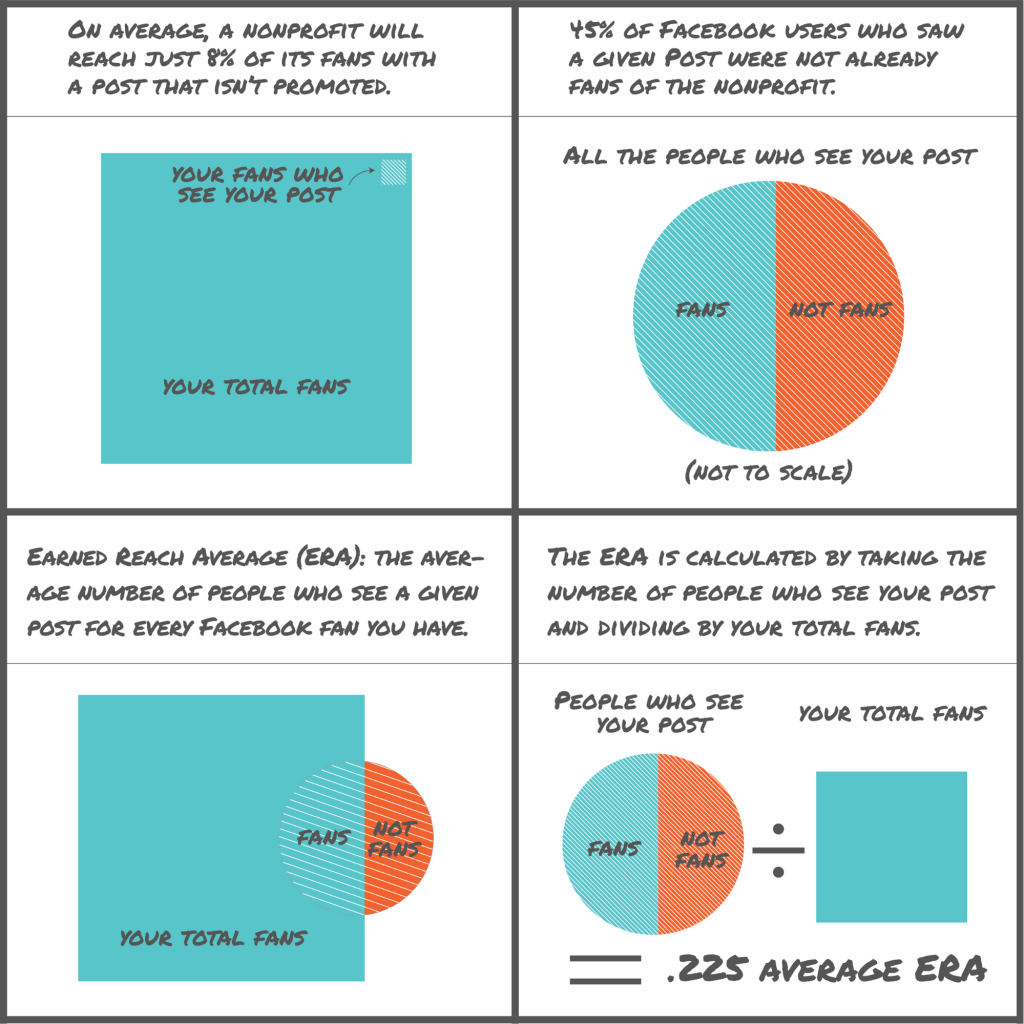
You likely already know that the number of people who like your page is not a good indicator of how many people your post will reach. Still, as your page grows, you’d expect to see reach increase. What nonprofits need is a way to compare month-over-month, year-over-year how effective their posts are at reaching people.
With that in mind, we measured Earned Reach Average (ERA) in this year’s benchmarks report. This number takes the number of people you’re reaching and puts it into perspective with how many fans you have—read more about it here. Measure ERA for each of your posts to find high and low performers even when your page is rapidly growing, and compare your average to other nonprofits in your sector.
WHAT CONTENT DO PEOPLE ENGAGE WITH MOST?
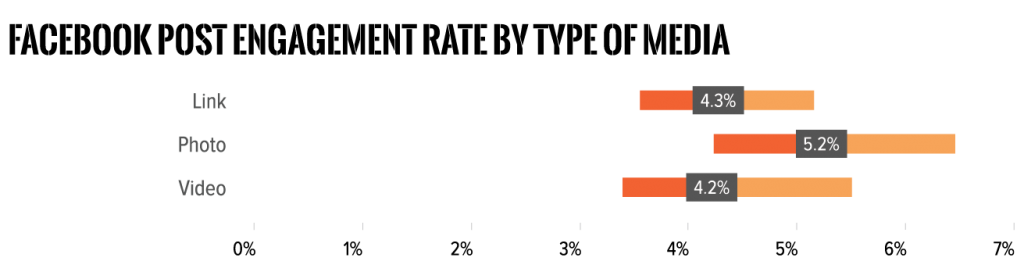
Engagement rate is one of the most important post-by-post performance metrics in our report—it tells you what percentage of users reached by a post engages with it (by liking, commenting, sharing, etc). Overall, nonprofits have an average engagement rate of 4.6% on Facebook posts.
In our 2017 report, we did two extra pieces of analysis on Facebook engagement rates, based on the questions we’ve received in previous years.
First, we looked at how engagement rates vary by the media that is being shared. We found that posts with photos averaged a higher engagement rate than those with links or videos:
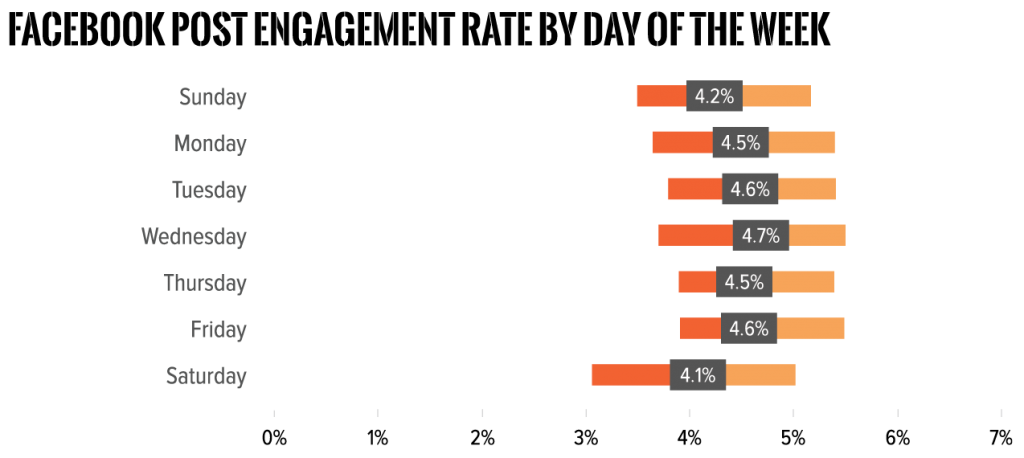
We also looked at Facebook engagement rates by day of the week. As you can see from the chart below, there isn’t a lot of variation by day… except for Saturday!
We can’t tell exactly why nonprofits saw lower engagement rates on Facebook on Saturday—it could be a worse day for posting or organizations might be posting less engaging content on that day. It’s hard to say! But as always, the best benchmarks are you own. If you find posting certain content on a certain day gets a response from your audience, stick with that!
Have questions about social media metrics? Tweet at @MRCampaigns
Check it out: the Social Media Director’s Guide to M+R Benchmarks. How do you compare? https://t.co/xZY2pPfjCy pic.twitter.com/geo13kX13g
— M+R (@MRCampaigns) August 29, 2017