
Yes, there are many, many things about 2020 that we’d just as soon forget. And yes, 2021 has already been roughly 7,000 days long. But the past is close behind, and there is plenty we can learn from the 2020 end-of-year fundraising season that will help improve our fundraising efforts in the year ahead. No matter how long the year ahead ends up seeming.
Before we get into specifics, some business about how we looked at this data: because Giving Tuesday jumps around, we can’t just look at December revenue year over year and keep things apples to apples. So, to be safe and consistently compare one year to the next, all of the year-over-year figures cited below are for November and December combined unless otherwise noted. We also use the median for our comparisons, so that one outlier doesn’t skew the whole set. And boy, were there some outliers this year.
On to the goods!
Giving Tuesday: December Edition
There are so many reasons to love Giving Tuesday. The revenue, of course. The national spotlight on charitable giving and important causes. The lively kickoff to the end-of-year giving season. The ambitiously large sandwich you can make out of Thanksgiving leftovers.
Of the 25 M+R clients who provided data for our Giving Tuesday analysis, 74% saw an increase in overall revenue, 60% reported an increase in gifts, and 44% reported an increase in average gift. Revenue increases were widespread, but not uniform—some nonprofits saw an influx in mid-level and large gifts, while others grew their low-dollar conversions.
Unlike the broader EOY season (more on this in a moment), Giving Tuesday revenue is still primarily driven by email: on average, 55% of total revenue on and around Giving Tuesday was attributed directly to email. But even though overall revenue went up, email revenue remained flat, with only a 2% increase.
Overall email volume remained basically flat. Organizations sent an average of five emails around Giving Tuesday 2020 as well as in 2019, with email volume declining by 10%.
One notable difference when looking at Giving Tuesday year to year is when these emails are sent: every group in our sample sent at least one email before the special day, with groups sending as many as three pre-Giving Tuesday emails. This follows the broader trend we see in the e-commerce world: you might also remember that promos started so early that Black Friday seemed more like Black Friday Month.
EOY was up, up, up!
One of the universal—and heartwarming—truths is that people will help each other in times of need. That was wholly evident in our 2020 EOY fundraising numbers: supporters stepped up when nonprofits asked for help.
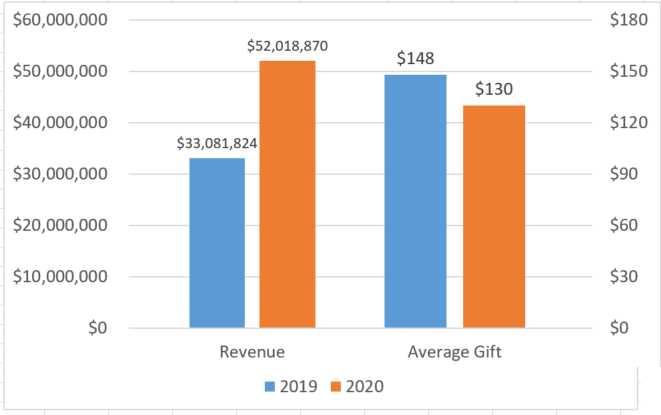
For the 17 groups who were able to provide us comprehensive year-over-year data, the median increase in revenue was 35%, with a 38% jump in the number of gifts. Average gift was nearly flat year over year for the median organization, but this metric is especially volatile and easily pulled by outliers. Some groups saw average gifts down by as much as 66%, while others saw an increase of 100% or more—all because of just a handful of really big gifts. Consider this your yearly reminder that the “average gift” tells you very little about the overall performance of a campaign.
Inboxes keep blowing up!
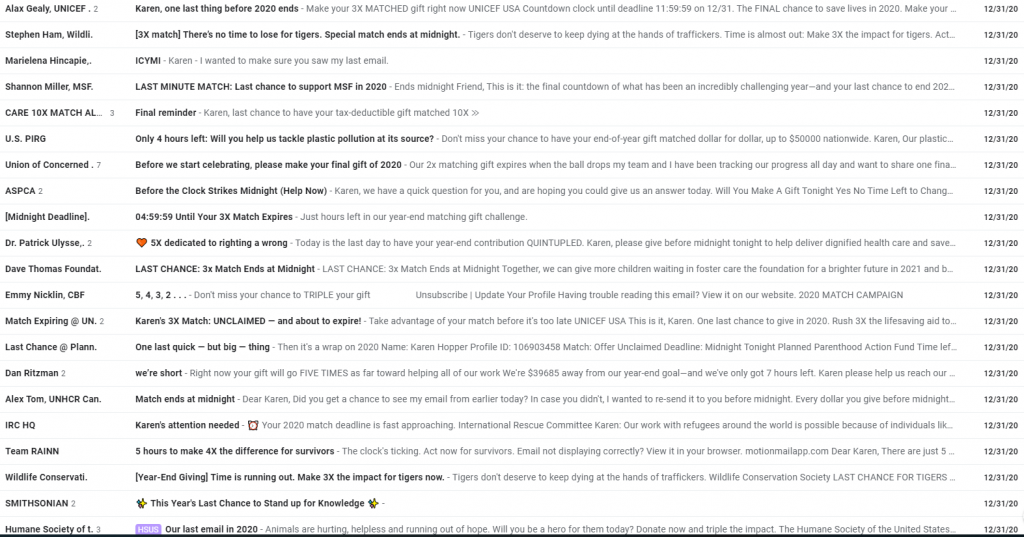
Let me assure you: email volume is still robust. Just like in 2019, nonprofits sent an average of 12 email appeals during the 2020 EOY campaign, and that doesn’t include Giving Tuesday or non-appeal emails.
The cause of such a large increase in revenue without a similar increase in the number of appeals is decidedly mixed. Some groups had standout years with audience growth and response rate—due in no small part to the pandemic (think: front-line organizations like food banks). Other groups had smaller, more active lists, thanks to increasingly aggressive inactive suppression and reactivation strategies.
Whichever boat you find your nonprofit floating in, email clearly remains a heavy hitter in fundraising: nonprofits attributed 26% of their overall EOY revenue directly to email.
Ad programs are growing up
Over the years, nonprofit organizations have matured their ads programs quite a bit. We’re targeting email subscribers who aren’t opening, donors who haven’t donated, people who seem like they might like us, and so many other categories of users, with ad creative tailored to capture attention, target users likely to donate, and quickly communicate how a gift will help. Just look at these :heart-eyes:


This skill and investment is paying off. Not only did the organizations for whom we have detailed data see an immediate return on ad spend (ROAS) of $2 on average, but groups generated 22% more revenue (last click) even though they were spending, on average, about 11% less.
Texting is getting up close and personal
SMS was 2020’s hottest not-so-new channel. You probably got more than a few text messages this election cycle—whether from peer-to-peer (p2p) platforms that create a 1:1 experience or blast messages from companies or nonprofits who collected your mobile number at some point.
Your phone is blowing up with texts because, well, they work. Even if you do not have a high-volume SMS program year-round, sprinkling text messages throughout the stream of your regular campaign can increase engagement and (potentially) revenue.
Aggregate data is tricky here—we don’t have enough data points to pull out medians without exposing individual organizations. But the individual experiences are telling. One M+R client has run a test texting half of their email list three times in addition to their regular 10 EOY email appeals. The boost in performance among those who got text messages was dramatic: a 97% increase in overall campaign response, and a 57% increase in revenue per recipient. Another nonprofit saw a 388% improvement in EOY revenue year over year from their SMS blasts. Another sent blast messages to more than 100,000 recipients on Giving Tuesday and saw a return of $1 per subscriber and a response rate of 5.6%.
More data would be wonderful, but these experiences make sense. Users are naturally more engaged in SMS; according to the 2020 M+R Benchmarks Study, the clickthrough rate on a blast fundraising SMS message is 4.2%, compared to email, where clickthrough rate on fundraising messages is only 0.56%.
If you’re in the business of setting resolutions, starting or building an SMS for your fundraising program in 2021 is a good one!