
 By Marc Ruben
 A few weeks ago, M+R gave glorious birth to our 2015 Benchmarks Study — in which 84 nonprofits pulled data on 7.5 million advocacy actions, 6.4 million donations, and 2.5 billion (with a B!) email messages, and we created one mother of a spreadsheet. Last week my colleague Marjory shared 5 things communications directors should learn from Benchmarks. Now it’s the advocate’s turn.
For those of us who practice the dark arts of online advocacy to build power for good causes, there’s some curious stuff going on in the Benchmarks data this year:
- More people are opening advocacy emails. Advocacy open rates in 2014 were 16% — that’s 9% higher than the same organizations saw in 2013.
- Fewer people are taking action. For every 1,000 advocacy emails an organization sent, they generated 29 actions (we’re talking basic fill-out-a-form stuff like petitions and letters to Congress). That’s down 18% from the same organizations’ response rates in 2013.
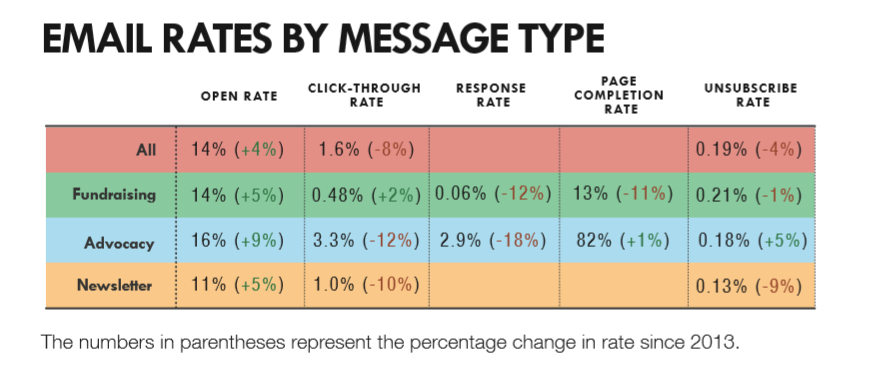
But wait. Why would organizations be seeing higher open rates and lower response rates?
First, let’s consider those awesome open rates. Why are they up so much all of a sudden? Well, turn your attention to page 15 of the Benchmarks study: 47% of study participants are suppressing “inactive” subscribers in some way when they send email. Groups have different definitions of “inactive” and different protocols for suppressing them, but given that open rates are up across all types of messages (not just advocacy), my own best guess is that more messages are probably reaching the inboxes of more engaged people who are more likely to open them.
Then, shouldn’t response rates also be higher if that’s true?
Theoretically, yeah. But I have a few possible theories about why all those opens aren’t translating into actions — some, or all, or none of which could be true:
Hypothesis A: More opens on mobile. We know more people are reading emails on their phones, and that response rates on mobile are lower than they are on desktops (presumably because it’s kind of a pain in the ass to fill out a whole form on a phone screen). So maybe more people are seeing the email but fewer people are clicking through and actually taking action.
Theory B: We’re getting too good at our jobs. Advocacy programs of all shapes and sizes are getting better at rapid response, better at capturing the issues of the day, and better at giving people an action to take in pretty much every email they send. Meanwhile, subscribers are also on more lists, and action opportunities are saturating their inboxes. Maybe as advocacy email lists become a better and better source of timely news and actions, people are opening them to see what’s going on in the world, but they’re less likely to take action on any given message — reading lots, responding little.
Theory the Third (sort of a corollary to Theory B): This is it,
OK, enough with the conjecture. Ultimately, no matter the cause, our charge as campaigners remains the same: compel people to act. Write from the heart, cut the bullshit, show people the path to victory and make sure they know we won’t get there without them.
Now, this post has focused a lot on email. And as we all know, email is a just one part of an advocacy program. There are lots of things the Benchmarks data doesn’t tell us — things that keep me up at night as someone who thinks a lot about online/offline integration. How many people did we move into real-world action? How well are we reaching influencers? Are we getting our stakeholders to do what we need them to? Did we actually, y’know, win stuff?
If you run campaigns, these are the measures that REALLY matter. And they’re a lot harder to measure. You can’t compare any of these across an entire sector. You can’t put them into a behemoth spreadsheet and boil them down into handy-dandy metrics.
That’s why it’s so important to plan your campaigns in a disciplined way.
And if you can do that, you have a better shot at changing the world. Which is why you got into this whole thing in the first place.
THE END.
P.S. OK, let’s be real, I like handy dandy metrics as much as the next guy. So, before you go, a few BONUS advocacy learnings from #3DBENCH15:
- For every 1,000 email subscribers, organizations had an average of 285 Facebook fans and 112 Twitter followers.
- Email lists grew an average of 11% net.
- Organization sent an average of 3.9 email messages per month, per subscriber.
- Larger organizations had lower advocacy email open rates. But when you look at advocacy response rates, medium-sized groups (100k-500k deliverable addresses) had large groups beat.
- Environmental groups were the only sector to send more advocacy emails than fundraising emails. They also send the most messages overall. And their advocacy click-through and response rates left other sectors in the dust. (Say it with me: Correlation doesn’t imply causation!)
(For more detail, see pages 15-16, 20-22, and 42 of the study. But really, you should read the whole thing.)