
 By Amy Peyrot
 M+R’s annual Benchmarks Study looks at a great big mountain of online data for dozens of nonprofits, including fundraising, advocacy, email, marketing and web stats. It is seriously great, and you should read the whole thing and also enjoy the photos of swimming pigs (page 19).
But those of us who focus on social media for nonprofits are special, wonderful people, and we deserve special, wonderful, and above all useful content of our own. So let’s take a look at what #BenchmarksX has to say about your strategy and content for Facebook, Twitter, Instagram, and more.
BENCHMARKS JUST FOR YOU
Here are four key questions our report will help you answer about your social channels:
1) How many people *should* follow you on social?
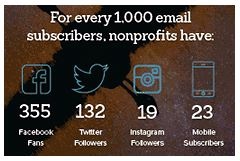
The best way to measure yourself against other groups is to look at your email list and see how your subscriber numbers compare to the number of people who follow you on Facebook, Twitter, and Instagram (new this year!). But here’s the catch: it varies drastically by sector. (Cultural groups actually averaged more Facebook fans than email subscribers!) So download your copy of the Benchmarks report and turn to page 47 to see how you stack up against organizations like yours.
2) Who are you actually reaching on Facebook?
A Zen koan for our age: If a photo is posted on Facebook, but nobody actually sees it, does it generate any clicks? (The answer is no. It’s not a very good koan.) You probably know that the content you post — the carefully curated, thoughtfully produced, extremely engaging content — doesn’t actually reach everyone who follows you. On average, a Facebook post only reaches 10% of your fans if you’re like the groups in our study. This is irksome.
On the other, non-irksome hand, that “10% of your fans” group only made up half the people who saw the post. Just as many people who are not fans are likely to get the post in their news feeds. It’s one of the best things about social media: you’re reaching people you otherwise might not have access to. And it’s a good reminder that your social media content could be the first impression you make on a potential supporter.
On a given day, groups in our study reached 244 people for every 1,000 Facebook fans they have (but again, this varies by sector – check page 51).
To see if the average reach on your Facebook page matches up, try this formula using stats pulled from your Facebook Insights (Page Level):
(Daily Total Reach / Total Likes on the Page that Day) x 1,000
3) How are people engaging with your social content?
If social media is part of your online direct response strategy — and it seriously ought to be — then just having a big reach isn’t enough. You need to track how many people actually engage with your posts. The Benchmarks Study lets you compare your average engagement rate* with groups that are similar to you. The average engagement rate for a nonprofit Facebook post is 5.4%. For Twitter it’s 1.6%. Here’s a closer look at the rates by key nonprofit sectors:
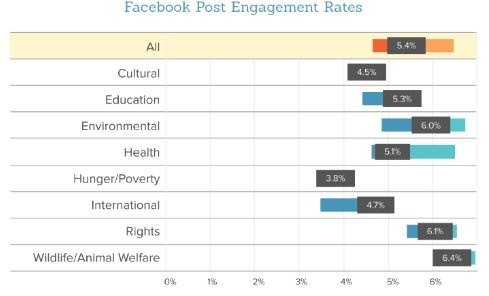
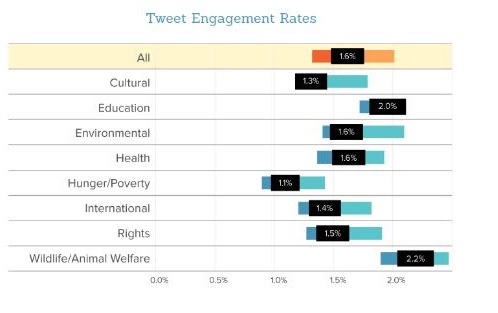 *Here’s how to get your engagement stats: Twitter Analytics will export your engagement rate for every tweet — it’s already calculated for you. For Facebook, divide the number of Engaged Users for your post by the number of people it reached.
4) Do you post enough? Too much? The just-right Goldilocks amount?
OK, our report actually isn’t going to tell you the answer to this. What is “enough” and what is “too much” will vary for every group, and a good rule of thumb is don’t post if you don’t have something good to say.
However, our report can help you see how you line up against other groups on Facebook and on Twitter. On average, the groups in our study posted to Facebook 1.3 times per day and Twitter 3.8 times per day.
LESSONS LEARNED FROM THE REST OF THE REPORT
If you only read pages from the Social Media section of our report, I guess I will forgive you (especially if you Tweet out a few stats from it – c’mon, I made it so easy!) But there is so much good stuff in the rest of the report, including detailed email and web stats that give you a far more complete picture of how your supporters respond to your content.
I don’t want you to miss out, and since you’re probably busy figuring out how to deal with Facebook’s latest algorithm change or set up Snapchat, I saved you the time and pulled out three things you should take away from the rest of the report:
1) When it comes to fundraising, email is your friend.
Guess what? Email’s not dead! From 2014 to 2015, email-driven revenue increased 25% for the groups in our study — faster than the 19% growth in online revenue overall. So if you can move your social media followers to your email list, you’ll have them in a fast-growing, effective, and not-actually-dead-it-turns out fundraising channel. There are many ways to do this — talk to us about building a quiz or other interactive that captures email addresses and compels people to share on social.
2) Think about the first emails your supporters will get.
If you’re getting your awesome, engaged fans and followers to sign up for email too, you should know what they’re going to see when they join. Use pages 9 and 10 in our Benchmarks report — a miniature section on welcome series — to spark a conversation with the director of your email program. It could be the beginning of a beautiful friendship.
3) Start spending, but have a goal.
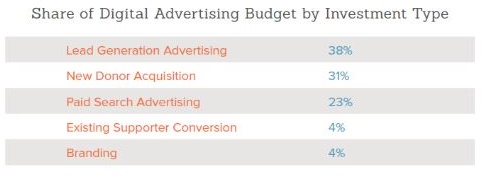
The top 25 nonprofits in our study (those seeing the most year-over-year revenue growth) spent $0.12 on digital advertising for every $1 raised online in 2015. That’s not direct ROI — it’s about the budget nonprofits are devoting to digital ads relative to overall online revenue. This wasn’t limited to social media advertising, but it’s still important to know that if you’re thinking about spending for social, you’re not alone. Most of the money being spent on digital ads was meant to either get email addresses of prospects or donations from new donors. Facebook’s powerful targeting options and flexible budgets make it easy to bring in supporters that are going to be valuable for you.
What social media benchmarks do you want to see in next year’s report? Leave a comment below or Tweet to @MRcampaigns to let us know!
Check it out: The Social Media Director’s Guide to Benchmarks. #sm4np #nptech https://t.co/jk0me6RTnq pic.twitter.com/D4AMPp18KG
— M+R (@MRCampaigns) June 2, 2016