
Read time: 10 minutes
The story so far: nonprofits experienced a somewhat rocky end-of-year fundraising season in 2018. Sure, there were some bright spots, but plenty of mixed results and mixed feelings. The preliminary data left us with more questions than answers.
So we did what we do: dug deeper into the data. Consider this a preview of our upcoming Benchmarks Study (which will be released in April), and our attempt to answer a few burning questions:
- Did the new tax law impact giving for any or all donor segments, particularly mid-level givers?
- Did the recent turbulence in the stock market lead donors to be more conservative in their giving?
- Was 2017 such a strong online fundraising year for many organizations that 2018 was a return to “normal” for some or many groups?
- Did political fatigue, wins, or changing issue focus impact giving (especially for politically-oriented organizations)?
- Did the increased focus on Giving Tuesday decrease December giving?
- What was the role of technical challenges—in particular email deliverability—on revenue? (JK we already answered this one!)
- Is email dead? (JK we already answered this one too!)
Let’s start at the beginning (of our list):
Uncle Sam’s Effect
The burning question on everyone’s mind going into the biggest charitable giving season was around the tax law: now that fewer people benefit from the tax-deductibility of charitable donations, would people just… stop giving?
If the changes to the tax law made a difference, we would expect that impact to be felt more strongly among donors who are likely to be itemizing their deductions. We can’t access that information directly, so we analyzed the change in the number of $500+ gifts made in December 2017 and 2018. Our sample included more than 50 nonprofits of a variety of sizes and issue areas.
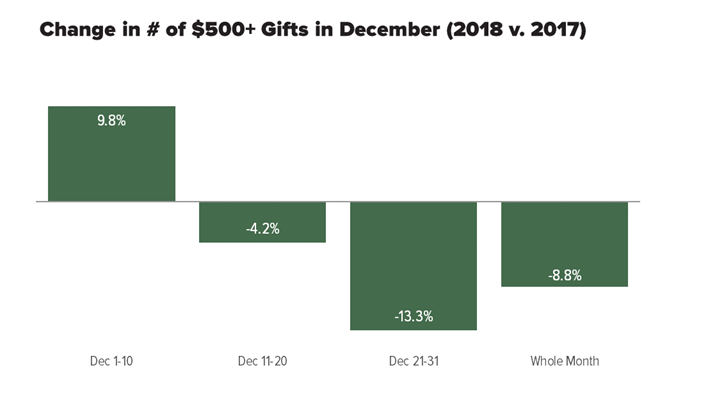
Overall, the median group saw a 9% drop in the number of $500+ gifts in December year over year, concentrated primarily in the second two-thirds of the month. This is suggestive, but not definitive proof that the tax law motivated these donors to give (or in this case, not give) this year. It’s worth noting that the stock market was also having a … moment during EOY as well (more on that in a minute!).
And, well, people are complicated. When donors were asked why they gave in 2017 but not in 2018, answers were all over the map. Some donors said they no longer had the means to donate. Others mentioned the frequency of solicitations they received; still others mentioned the infrequency of those same solicitations. We heard from donors who didn’t approve of the political nature of a nonprofit’s organization’s messaging, and yes, more than one mention of the tax law.
So there is some evidence that suggests that mid-level and higher donors scaled back their giving as the tax incentive went away, but there’s probably more to it than that. And it’s also true that we’ve seen nonprofits make substantial improvements in their mid-level programs even in the wake of these changes. Individual strategy can certainly overcome general trends.
It’s also worth keeping in mind that if you’re relying too heavily on tax incentive messaging in your EOY fundraising, you might see less of a return as certain pools of donors are no longer impacted by those incentives.
The stock market
I’ll admit, I’m no stock market expert. But the people who talk about that stuff on NPR during my morning commute seemed really sad and stressed out right before and through Christmas. Mostly because of this:
Dow Jones Industrial Average in December 2018
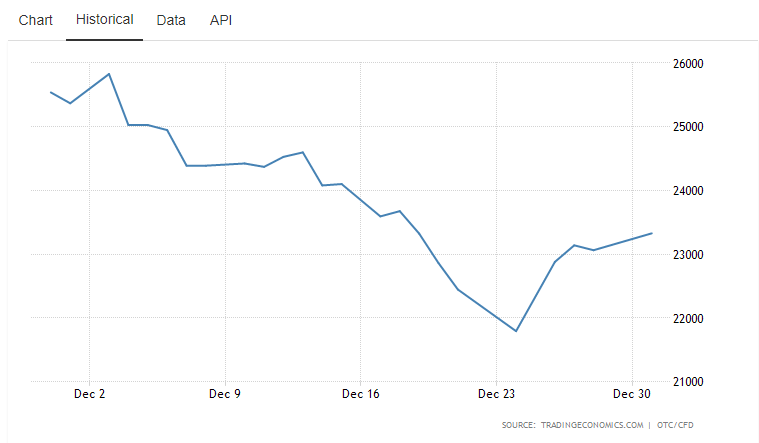
Starting right around December 15, the stock market took a tumble, and giving seemed to take a tumble right along with it for our participating organizations. The median group received 6% fewer donations in the last 10 days of the year than they did in 2017. Even though the market started to pick up in the last few days of the year, the damage was done.
This corresponding dip certainly supports a theory that decline in giving had something to do with the decline in the stock market, but of course these donors could also have been more motivated by tax incentives in past years.
As is so often the case, a clearer picture will depend on more data. The tax law is here to stay (for now), so moving forward we’ll have a chance to see if changes in donor behavior continue to track changes in the markets.
Did the Trump Bump hit a slump?
Has the enthusiastic outpouring of support from donors in response to the 2016 election finally come to an end? Are we returning to normal? What is normal anyway?
We sent our time machine all the way back to EOY 2014 to gather a baseline, and measured every EOY since as growth against that baseline.
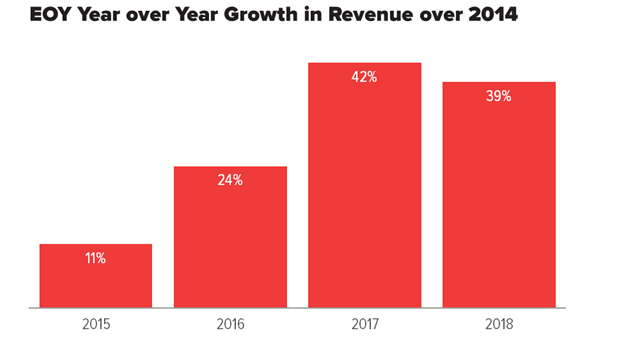
This chart shows the growth of EOY revenue each year, compared to 2014. So EOY 2015 generated 11% more revenue than EOY 2014, 2016 generated 24% more than 2014, and so on. In this broader context, it’s 2017 that looks like an outlier, with an extra-large jump very likely driven by the changed and charged political landscape.
This tracks with our experience working with nonprofits who tend not to lean into political fundraising, such as those in the international, wildlife and animal welfare, and health sectors. Generally, these nonprofits seemed to experience less of a peak in 2017 and then less of a cliff in 2018, with some of them reporting significant or modest growth in 2018. But that’s just anecdotal: we’ll have our regular sector-by-sector fundraising breakdown ready for primetime in Benchmarks 2019 this April.
TL;DR: Yes—there is some indication that this is a return to normal, and that when groups project for coming fiscal years, 2017 should be treated akin to an emergency year. That is, the revenue was nice to have when it came, but it’s not sustainable, and we can’t count on an “emergency” every year.
What about attention fatigue? Aren’t there emergencies ALL THE TIME now?
And what about the donor fatigue that comes along with that?
This is the one that gets tricky to prove (or disprove) with data, since there are so many other variables at play: how did world events shape the landscape for different groups? Were there factors beyond Trump that could have played a part in a 2017 bump (or lack thereof) such as hurricanes, famine, scandals, bad press, that thing where Warren Beatty said that La La Land won Best Picture but actually it was Moonlight, technical and deliverability challenges, and more?
Unfortunately, the data is still crunching for our full Benchmarks report (have I mentioned it comes out in April? Have I mentioned I am excited?). As of now we’re not quite ready to share trends in response rates, message volume, or overall donor retention—the metrics that might shed some light on trends in donor behavior.
It’s also a good time to remind you that your organization is special and unique in its own special and unique way—and you have to be tracking things like open rates, response rates, unsubscribe rates, and level of engagement on your social channels over time (among the many metrics you should be tracking!) to get a read on this for yourself. The only way to improve program performance is to understand how the program is performing in the first place. #datamicdrop
Hashtag Giving Tuesday
“But wait!” You say. “Isn’t there a good chance that our trusty, reliable EOY donors are being swayed by shiny #GivingTuesday promotions and abandoning us in our time of EOY need?”
If I had a nickel for every time I heard this as a possible explanation for declining EOY returns, well, I’d put those nickels into the little overflowing bowl of change that I keep by my front door because who wants to bike to work with a pocket full of coins? But thanks to detailed transaction data from more than 50 organizations, we can honestly say: nope. That’s not true.
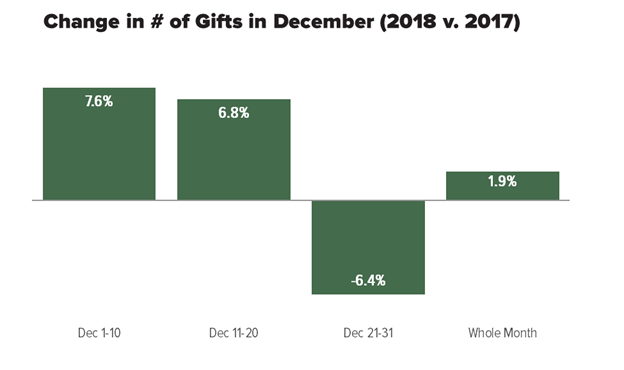
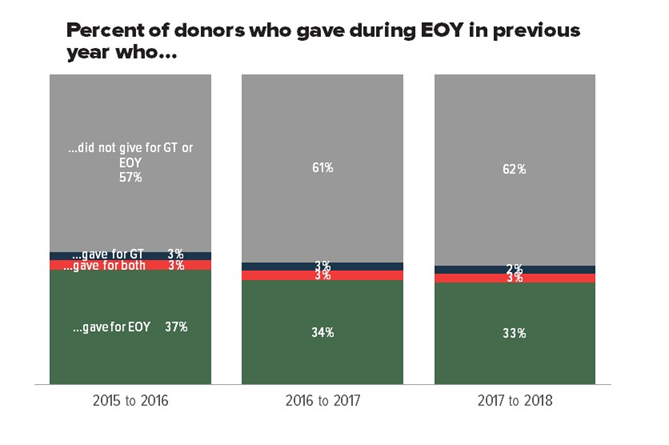 There’s a lot going on here, so let’s break it down. First, a large-but-mostly stable chunk of EOY donors simply don’t come back to give again the following year, whether to Giving Tuesday or at other points in December. (That’s the gray bar above.) This isn’t to say that they don’t give during other parts of the year, but it is suggesting that the pull of that “same time of year, same type of gift” isn’t as habit-forming as it may have been in the past.
The data also shows that even though Giving Tuesday has seen a meteoric rise in the past 3 years, the proportion of donors who move from one bucket (EOY donor) to another (Giving Tuesday Only donor) is staying relatively steady. And tiny—2-3%. So no, last-chance-December-deadline donors are not turning into Giving Tuesday donors in droves.
Deep Sigh
We all want one thing to point our fingers at and say “yes, THAT is the reason EOY was the way it was”—but as we now know from all of this beautiful data, that’s impossible. It was a cluster of events, right on down to the conspiring stock market in the waning hours of 2018.
It does, however, feel good to have some closure on those haunting questions:
- Yes, the change in tax law seemed to have some impact, though its effect cannot be completely separated from the stock market volatility during the final weeks of the year, and may have even been compounded by the stock market.
- Yes, the stock market trended downward right at about the same time that the donations began to slow as well, and that effect might also be compounded by the changing tax law. Seeing a pattern here?
- Yes, 2017 seemed to be an extraordinary year for fundraising across organizations, especially ones that leaned particularly heavily into fundraising around the Trump administration and various global emergencies, and 2018 seemed to be a return to normal. Or whatever normal is these days.
- Jury is still out on whether donors are especially fatigued this year by the sheer number of urgent issues demanding their attention, which could be reflected in lowering response rates and increased message volume. It’s hard to separate that from other issues, and we just need to crunch more data. Sign up to be the first to know when Benchmarks launches this spring.
- No, Giving Tuesday is not poaching all of your EOY donors and dollars. But you’re probably going to have to work even harder to get your EOY donors to retain during EOY next year.
- Yes, technical challenges had something to do with revenue trends during EOY, but it’s not what you’d expect. Go read more in our first EOY post.
- No, email is not dead. There’s a section in our first EOY post on this too.
Thanks for sticking with us through all the twists and turns of this December fundraising analysis. And guess what: we’ll have plenty more analysis and insight in a few weeks when we release our full Benchmarks Study.