
The average nonprofit in our 2019 Benchmarks Study reported an online donor retention rate of 37%. If that matches your experience, then nearly two thirds of the donors who give to you this year aren’t going to give next year. Of course, you should do your best to cultivate, appreciate, and retain those donors, but that won’t be enough to keep your program growing year over year.
You need to find new donors and recruit them to your cause—and for many nonprofits that means running digital ads. The starting point for many nonprofits is to build an audience similar to your donor file and deliver ads to them. Facebook, for example, offers an easy self-serve tool to build these “lookalike” audiences. You upload a file of your donors and the algorithm can find people who share attributes with those donors and thus have a high propensity to give.
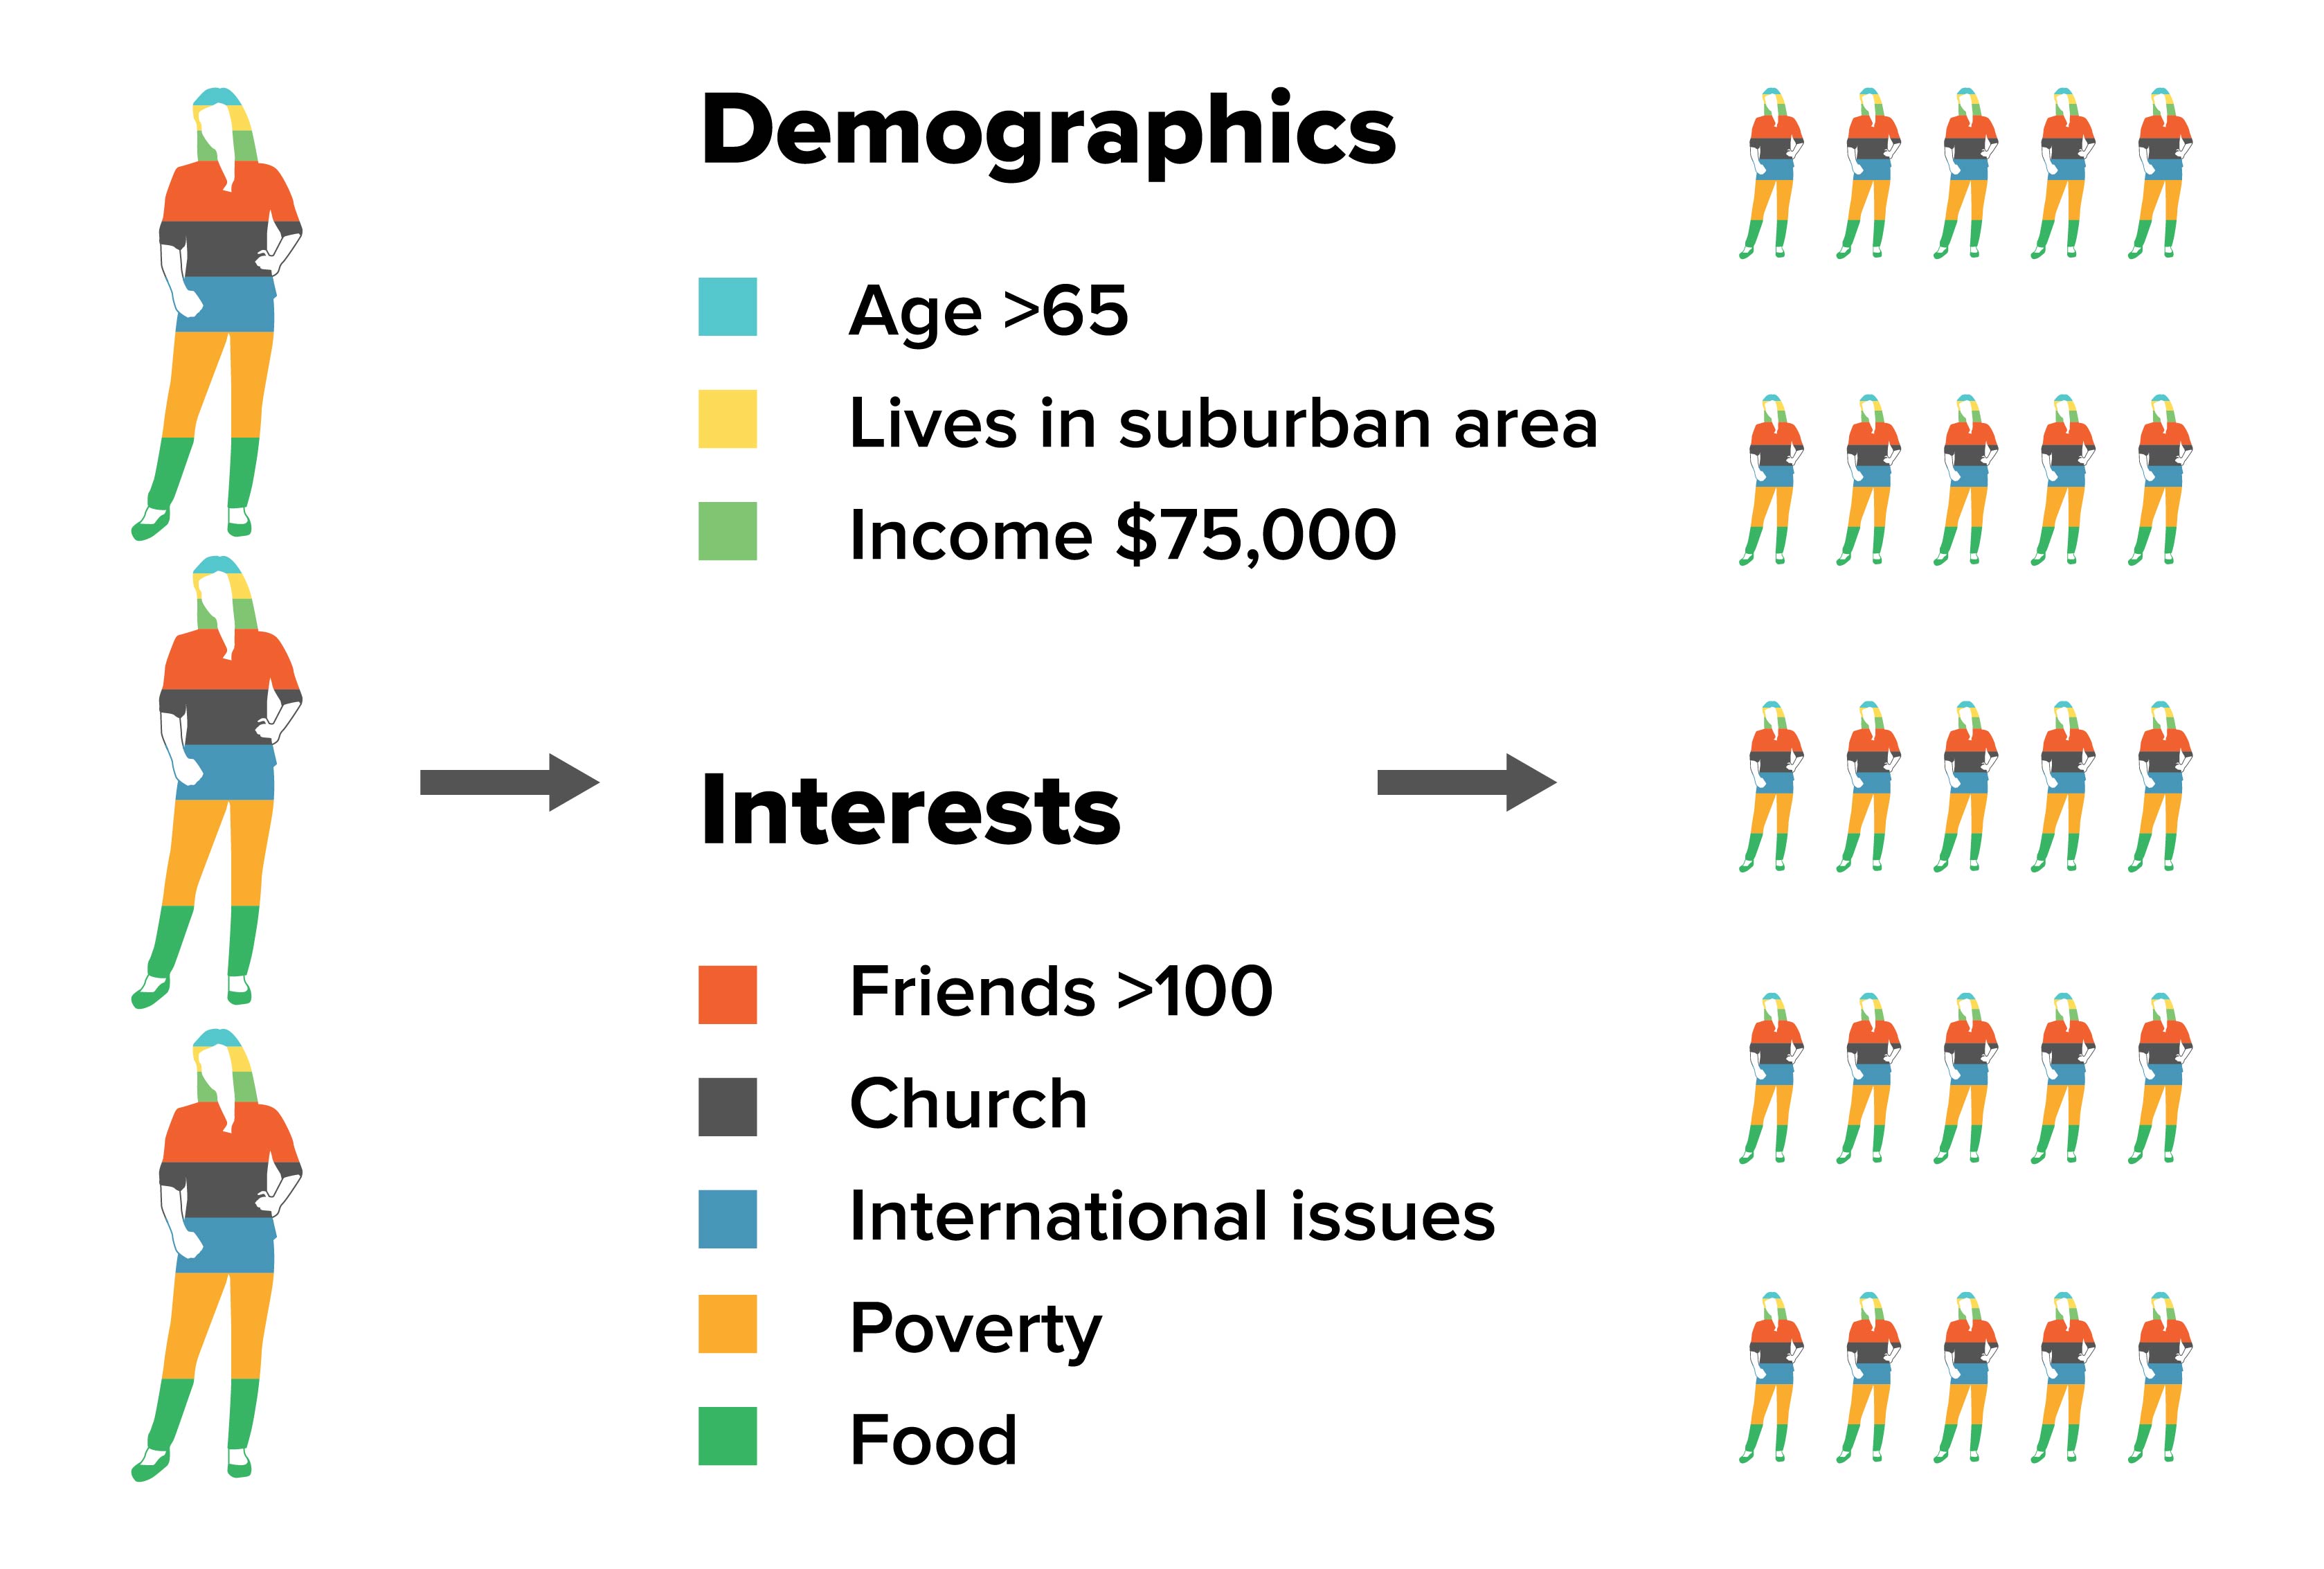 This modeling process gives you an audience that matches the dominant factors in your donor file, and in which everyone is similar to everyone else. But just because many of your donors are churchgoing suburbanites over 65 who are interested in poverty and international issues, that doesn’t mean everyone who might donate to you is.
For many nonprofits, establishing a more diverse donor base is an important goal for a wide variety of reasons. Sooner or later you’re going to run out of people who look just like the people you already have—your long-term growth depends on expanding your universe.
These are your Hidden Markets. Finding them, and then reaching them, takes some work, but it can pay off in a big way.
Our experience working with USA for UNHCR to find prospects that were being missed by their broader donor models provides a framework you can use to find your own hidden markets.
How do we find Hidden Markets? Through a cluster analysis.
A cluster analysis takes a group of people—in this case, the USA for UNHCR donor file—and looks at a variety of characteristics for each person. For UNHCR, we looked at demographic variables like age, gender, household income, homeowner status, and more. The cluster analysis then finds the most alike groups based on all the dimensions, simultaneously—including the hidden groupings that other donor analyses would have missed.
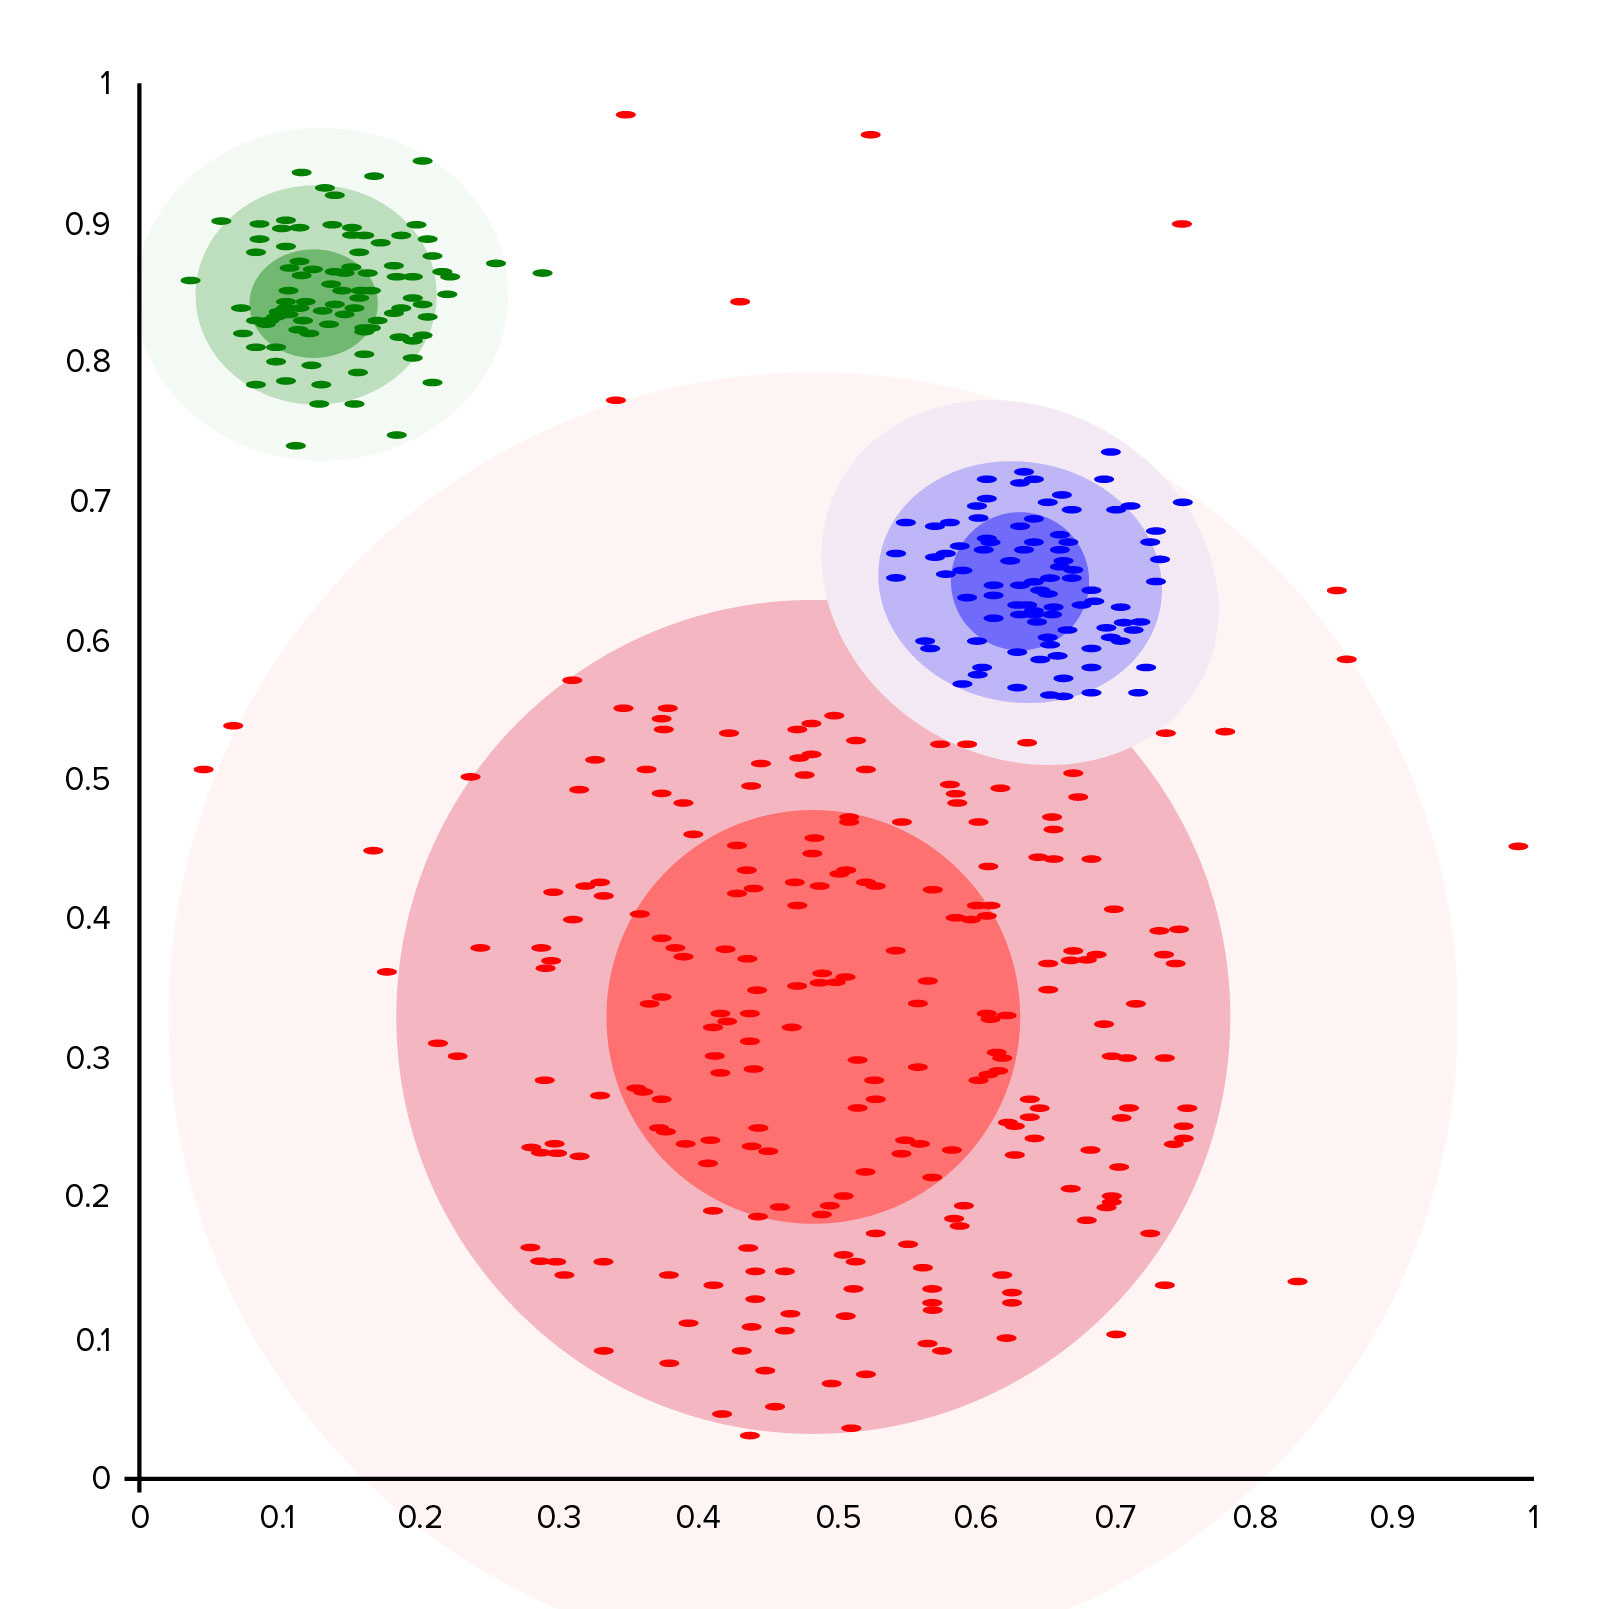
A simplified cluster analysis might look like the chart below. Each colorful dot represents a cluster—a set of shared traits where many individuals fall. If you are looking for the “average donor” on your list—or if you let Facebook or another platform do the looking—you’ll likely find people who look like the big red group of donors.
It’s not a bad place to start, but that group will run out eventually—and won’t help you diversify your base of support. But as you can see, there are two clusters here that don’t fall into the big red circle— your blue and green donors. They represent significant cohorts and can point you to promising new audiences to target, even though they aren’t similar to the “average” donors in the red group.
The analysis of USA for UNHCR’s donor file didn’t look this tidy—it had many, many more dimensions and would be impossible to visualize in a simple chart like this. Turns out, it’s hard to describe everything about who a person is with just a couple of demographic dimensions. And there’s a subtler problem: if we’re relying on a couple pre-fab demographic slices like income vs. race or ethnicity, that would leave us open to bias about how we already think about groups on our list.
Instead, we input many axes worth of meaningful behavioral and demographic variables. Then, we apply an algorithm to tell us where the pockets of people are.*
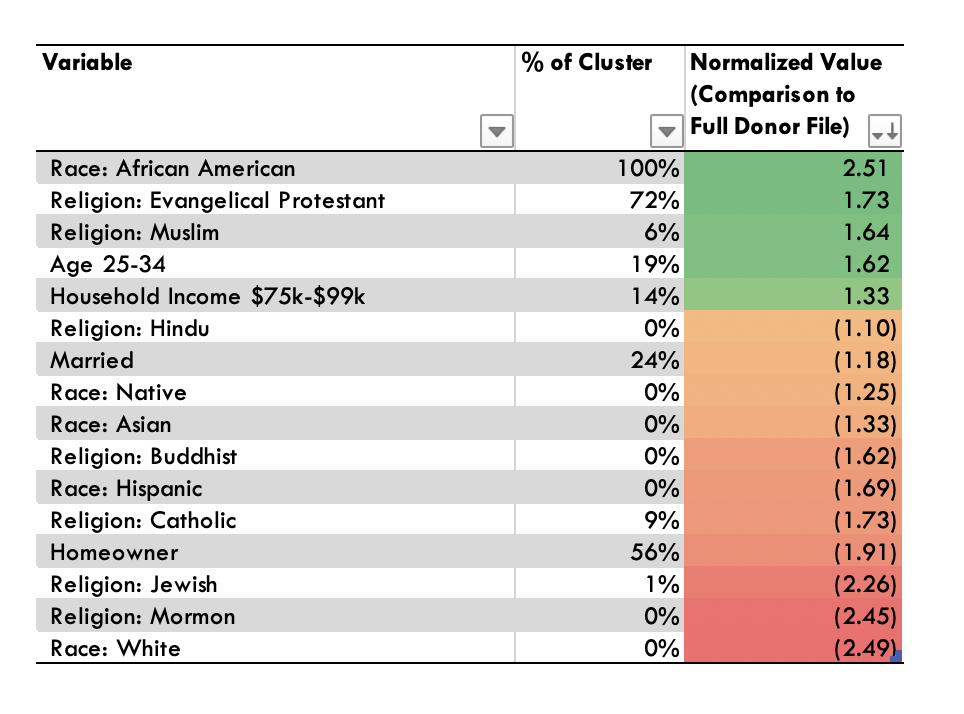
With the analysis done, we now had information on seven hidden markets in the USA for UNHCR donor file—and some of them were very different from what an “average” donor looked like. The chart below shows a snapshot of one of them.
In this chart, the % of cluster shows how much of the cluster shares that attribute. The normalized value is how that makeup compares to the donor file average. A high, positive normalized value means that a member of this cluster is much more likely to have that attribute. A negative normalized value means a member of this cluster is much less likely to have that attribute.
Side note: If the details of how to actually run this cluster analysis is what you’re looking for, you’re not going to find that here. It gets very specific and very math-y. But we like your style. If you are that passionate about using data to help nonprofits change the world, maybe you should consider coming to work with us.
So, this hidden market is a group of:
- African Americans
- Who are likely Evangelical Protestants, and much more likely to be so than an average donor; and
- Who are more likely to be Muslim, age 25-34, and/or have a household income $75k-$99k than the rest of the donor file—even if the majority of the cluster isn’t composed of one of these groups
This cluster is also less likely to be married, Catholic, or a homeowner than a typical donor.
Now, instead of one big lookalike audience that smooths over diverse sub-groups, we were able to build several lookalike audiences—each centered around a different cluster. From there, it was business as usual—we tested the same starting range of well-crafted creative to see what each new audience responded to, optimizing along the way.
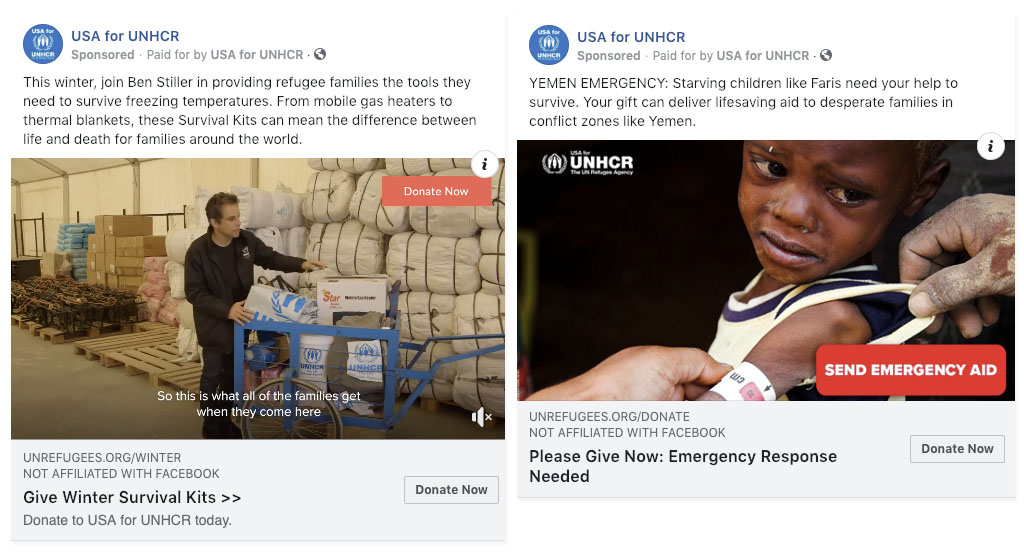
The types of creative that performed best varied for different markets. For example, these two ads were some of the lowest performers with our other audiences, but for Cluster 4 (one more likely to contain families) they were top performers. (P.S. Want to know what that well-crafted creative looks like? Check Gwen’s post on ads that work.)
More importantly, all of the ads we ran to these Hidden Markets had an immediate positive Return On Ad Spend (ROAS), meaning for every $1 spent we raised more than $1 in return. In fact, the lookalike built on Cluster 1 above outperformed our standard top lookalike modeled off of the full donor list! We tapped into a Hidden Market of people who would have been lost in the full file model AND who are actually outperforming existing audiences.
Hidden Market Modeling is allowing USA for UNHCR to more efficiently expand their donor acquisition efforts, reach new audiences, and raise funds to support refugees around the world—and there couldn’t be a more important time to do so.
If your nonprofit is ready to use Hidden Market Modeling to reach brand new audiences and do more good for the world, drop us a line at hello@mrss.com.
*Note: Edited from original post. We originally said we plug in “whatever [information] we can get our hands on”—which wouldn’t be a good way to do this and isn’t actually what we did. Thanks to the kind folks at The Agitator for pointing it out!