
Same as last year, but here’s to a different title next year.
Read time: 7 minutes
Remember last year? After the 2016 election, there was a massive spike in fundraising for a handful of nonprofits, and a 12% median growth in December revenue for the groups we tracked.
Then, 2017 happened. It went like this:

Some fundraisers were concerned that after a year of #womensmarch, #resistance, #takeaknee, and #metoo, supporters might not step up and give generously come end-of-year fundraising season.
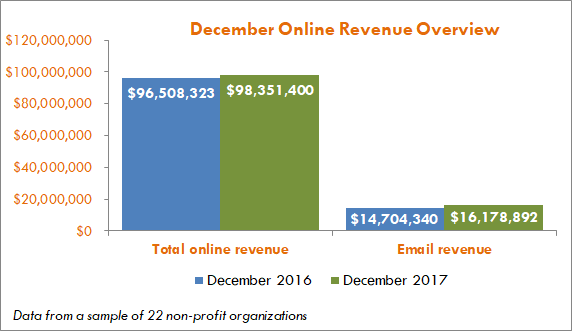
The short answer: they did! As we do every year, we looked at our own clients for a quick review of what happened in 2017’s online year-end fundraising. For the 22 organizations for which we have year-over-year (YOY) data, most saw a 12% increase in year-end giving over 2016. That’s the same median YOY increase we reported last year.
The longer answer: growth was not distributed evenly. But, it never is. Last year, we reported that nonprofits that turned (or remained) sharply political after the election experienced exceptionally strong growth. That means that they set the bar very high—and their numbers this year had a hard time keeping up. These groups actually saw a slight 3% decline from 2016 EOY revenue.
This doesn’t mean the audience cares any less than they did last year. But the success of the throw-everything-at-the-dumpster-fire-of-2016 post-election/end-of-year (EOY) season is difficult to maintain. As fundraisers, we need to trust our tried-and-true tactics, test new ideas, and innovate to reach new audiences while keeping the interest of the supporters we already have.
DEADLINE DEADLINE LAST CHANCE!
As usual, this was the state of my inbox on December 31:
Organizations continue to lean into the last chance messaging, and by and large, it still works: 23% of all December revenue came in on December 31st alone. This holds steady with what organizations saw in 2016, where 22% of all revenue was generated on that last day, last chance, deadline deadline deadline.
Speaking of my inbox…
Nonprofits in our client group sample sent an average of 11 email fundraising appeals this December (including catalog gift-giving messages for those organizations where that is applicable). This is a slight increase over last year’s average of 10 appeals.
Email list size, or at least the number of people receiving email, was slightly down. The median organization was emailing slightly fewer subscribers (-1%), but some groups cut their deliverable files by up to 50%, largely due to aggressive inactive suppressions. This is part of ongoing work to identify “dead weight” on email files—users that do not open or click emails for a set period of time can trigger spam filters on large providers like Gmail and Yahoo.
It seems to be paying off. Even with these extra messages and slightly lower audience sizes, email metrics are up:
- Response rate was up 25% for organizations for which we have YOY data, from 0.06% in 2016 to 0.08% in 2017;
- Open rate was also up 24% over 2016 for the 20 organizations for which we have YOY data (which is perhaps unsurprising to those of you who pay close attention to deliverability strategies);
- Average gift from email remained almost flat, with most groups hovering right around $105 for the second year in a row;
- Volume of email gifts was up by 8%
This all adds up to a 13% increase in revenue directly attributed to email.
Putting Yourself Out There
An ever increasing majority of organizations are employing an ever increasing variety of digital ads—display, social, search, all of the above—especially during EOY.
This year, 25 out of 31 organizations surveyed invested in paid ads in some form in December: a whopping 81% of our reporting organizations. This is up significantly from last year, in which only 65% of reporting organizations had invested.
This investment is paying off down the line as well. The average group reported a 140% ROI on their ad spend, which means that they brought in significantly more than they spent. Furthermore, for organizations where we had the revenue breakdown, 16% of all December revenue was attributed directly to ads via last click in 2017, a big jump from last year’s 5%.

– Donors in December 2017
The Tuesday After Thanksgiving
Did you think I would forget about this, my one true favorite holiday, hashtag Giving Tuesday?
This year, 21 out of 24 reporting organizations (or 88%) promoted a matching gift offer on Giving Tuesday, and a handful of those organizations even sweetened the deal with a special GT-only premium.
Facebook even got in on the #GT match action (maction?) this year, offering to match donations to nonprofits $1-for-$1 up to $2 million, and waiving their 5% processing fee for donations made through the fundraising tool on the day. In the end, Facebook reportedly processed $45 million in Giving Tuesday revenue for nonprofits, showing us that organizations are capitalizing on the social nature of the hashtag holiday.
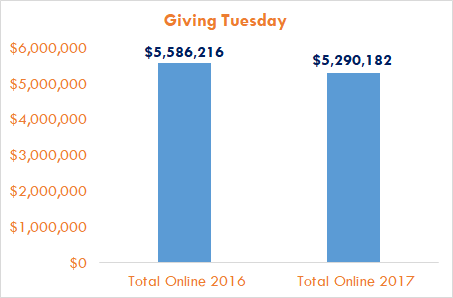
This marketing mania—mixed with at least a little bit of Black Friday/Cyber Monday guilt—worked well for many nonprofits. For our median organization, Giving Tuesday revenue was up by 24%. And yet, total Giving Tuesday revenue among our sample actually declined from 2016. That’s because a handful of groups saw steep YOY declines—as much as a 52% drop in GT revenue from 2016.
We think this decline is mostly a return to earth from a sky-high spike in revenue in 2016. Think of how aid groups sometimes see a massive outpouring in support after a natural disaster, followed by a decline once the crisis has passed. For some nonprofits, Trump’s election was a massive disaster—so they got the big jump in donations in the immediate aftermath, and are returning to “normal” a year later.
Certainty in the face of uncertainty
If there’s one thing we learned in 2017, it’s that we have no idea what the next curveball might be. Will Congress try to destroy healthcare for millions of people (again)? Will another natural disaster decimate a heavily populated area of the world? And of course, the potentially multi-million dollar question coming out of Congress in December 2017: what does the new tax law actually mean for charitable giving in the coming years?
In the face of this uncertainty, EOY 2017 showed some stability. Solid growth, continued innovation from nonprofits expanding into digital ads and other strategies, and reliable donor response. Deadline messaging gets the last-minute procrastinators to give. Sending email appeals to active supporters still drives revenue. Digital ads that follow users around the internet with sad puppies or starving children or environmental disasters work to keep issues in the forefront and convert new audiences.
The game might be different, but the rules are the same: Keep your messaging relevant, test new ideas, and scale the ones that work. Onward to 2018!
***
Want a quick blurb to share with your colleagues? Here you go:
Despite a tough, heartbreaking year, online year-end giving held steady for nonprofits in 2017.
- Overall: 12% increase in year-end giving over 2016.
- Email: 13% increase in revenue from email alone.
- Digital ads: 81% of orgs ran year-end digital ads, which accounted for 16% of all December revenue.
- Giving Tuesday: Total Giving Tuesday revenue declined, but median organizations saw an increase of 24%.
Yep. We used this title last year. That's because it's still true! https://t.co/O14taTKQzJ
— M+R (@MRCampaigns) January 30, 2018