Read time: 8 minutes
Everyone celebrates the end of the year in their own way. My friends, family, and other relatively normal humans mostly spent the closing days of December posting their 10 year challenge comparison photos on various social media platforms. Me? I was busy refreshing (and refreshing, and refreshing…) fundraising dashboards and Google Analytics. That’s how you make the money come in faster, right?
Now comes the real fun: sifting through all that data to see what we can learn. The short version: broad changes to digital fundraising had a sharp impact in December, and nonprofits that are behind on the trends are going to find it more and more difficult to keep up. But you didn’t come here for the short version, right?
First, some business about how we looked at this data: because Giving Tuesday jumps around, we couldn’t just look at December revenue year over year. Including that one special day in December one year but not the other skews all sorts of things, including the total number of fundraising days in each sample. So, to be safe, all of the year-over-year figures cited below are for November and December combined, unless otherwise noted. We also use the median for our comparisons, so that one outlier doesn’t skew the whole set.
Now that the details are sorted, on to the fun bit!
The tax law changes didn’t destroy fundraising (this year).
It’s been more than a full year since that fateful change to charitable giving deductions (even if it felt like 2019 lasted roughly 740 years). We’ve seen and participated in plenty of speculation about the long-term impact on nonprofit revenue, but, as all of us dedicated fundraisers know, giving to charity isn’t—and never will be—just about the potential tax benefits. And this year’s analysis proved that, at least in part. #correlationisnotcausation
For the 24 groups where we have detailed YOY data, the median group saw end of year revenue up 8%. However, that tax law might be coming in to play by impacting how much people give—the average gift was down 3% for the median group and much more for other groups.
Email is still important! But all of your eggs shouldn’t be in that basket.
Anyone in this space can tell you that email fundraising is hard, and getting harder. But we don’t believe in relying on feelings and anecdotes—so we looked at how email fits into the bigger puzzle of online fundraising.
In some ways, email was the same this year: for the first time since beginning these wrap-up posts, email volume stayed basically flat. The median group sent 11 emails this year, compared to 12 last year.
In other ways, email performance was all over the map: some groups who invested heavily in email acquisition and improved the size and health of their file in 2019 saw tremendous growth year over year. And thanks to some serious hard work and dedicated list maintenance, we also had fewer groups fall victim to deliverability issues this year than in the previous two years. However, groups with more established email programs struggled to raise the same amount of revenue as years past, often from smaller, albeit more active, lists. The net impact? Email revenue was down 3.5% year over year for the median organization, while average gift was down 6%.
That’s not to say that email isn’t a substantial portion of revenue—the groups in our study collectively raised more than $11 million dollars from email during EOY. That’s not chump change! But the portion of revenue directly attributed to email is falling: in 2018, 23% of all November and December online revenue could be attributed directly to email, but in 2019, that figure falls to 19%—a median decrease of 15%.
You might be wondering, “But wait! Don’t people get emails and then decide to donate in other channels, just like people who see an ad might not donate by clicking through the ad? That’s what view-through credit means, right?”
Right you are! The pathway from awareness to inspiration to donation is rarely straight. So we also shouldn’t assume that once someone is on our email list that they’ll only donate through email.
Perhaps we should be rethinking email attribution models beyond direct response. When we look at revenue generated from active email subscribers for a few of the organizations in this analysis, it accounts for an additional 23% of all revenue from this time period. That means that combined, active email subscribers are actually contributing 42% of online revenue—and in some cases, much more—since this doesn’t even include ongoing recurring revenue, like monthly sustainers.
The long and short is that email is still a valuable tool in the belt of the online fundraiser—but supporting your messaging in other channels is more important than ever.
Call me, beep me, but actually just text me
SMS blasts for fundraising are becoming more prevalent as SMS programs grow and mature; half of our sample are sending blast messages, engaging via peer-to-peer tools like Hustle, or both.
The return on growing those SMS lists is starting to show: A few groups in our study reported six-figure returns from SMS blast messages on Giving Tuesday and during EOY. Users are naturally more engaged in SMS; according to the M+R Benchmarks study, the clickthrough rate on a blast fundraising SMS message is 13%, compared to email, where clickthrough rate on fundraising messages is only 0.44%.
Beyond that, donors are becoming more comfortable using their phones in general, with overall site traffic and donation form traffic from users on mobile devices up year over year for almost every group in our sample—and for one group mobile visits increased by 40%!
Ads: tried, true, direct revenue
One of the best things about digital ad campaigns is that they generate a ton of data. Of course, that means there’s a lot to consider when trying to draw conclusions—ad performance is always impacted by the users’ experience with an organization’s home page, donation page, email series, and every other effort (and vice versa). But looking at the data from 2019’s EOY, some overall trends emerge.
Median ad spend was down 1.5%, as about half of the groups we surveyed spent less money in 2019 than EOY 2018, and less than a third spent more.
Despite the reduction of investment, more nonprofits in our survey did better this year than did worse, with almost half of all groups seeing higher revenue or number of gifts or both from ads in 2019. Median ads-driven revenue was within 1% of 2018 revenue, and only a few groups saw the dreaded combination of spending more and getting less in return.
Click-through gifts rose from 60% of all conversions in 2018 to 70% in 2019. That means that while the number of platforms is diversifying and organizations are testing more, most organizations are concentrating even more on platforms that drive immediate click-through gifts (e.g. Facebook/Instagram and Google Paid Search over Display).
What does this all add up to? Last year’s Benchmarks saw overall online revenue stagnate in 2018, and it looks like many organizations responded by cutting back on ad investment and concentrating on the core channels that bring in direct revenue. We will see if that holds true in this year’s Benchmarks.
Giving Tuesday: The creep is real
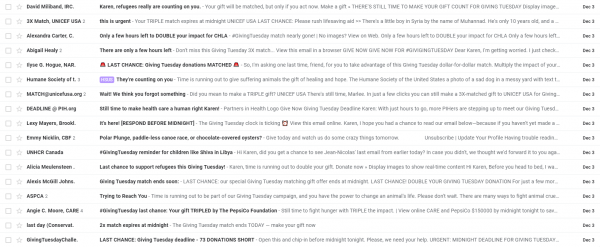
Just like we see Halloween decorations in July, we start seeing Giving Tuesday emails in September.
Ok maybe we’re not quite there yet, but there were at least a few organizations who went out with dedicated Giving Tuesday messaging two weeks or more ahead of Giving Tuesday. That’s some serious creep!
Beyond the advance notice, groups are sending more Giving Tuesday emails than ever, with the average group sending 5 appeals. That’s up one from last year, where groups sent an average of four. This high volume doesn’t appear to be hurting response rates, either: the overall Giving Tuesday email response rate in our sample was 0.09%.
Giving Tuesday email response rate is down slightly YOY, from 0.10%, but groups were still able to squeak out more revenue, thanks to those extra messages, with the average group generating 14% more email revenue year over year.
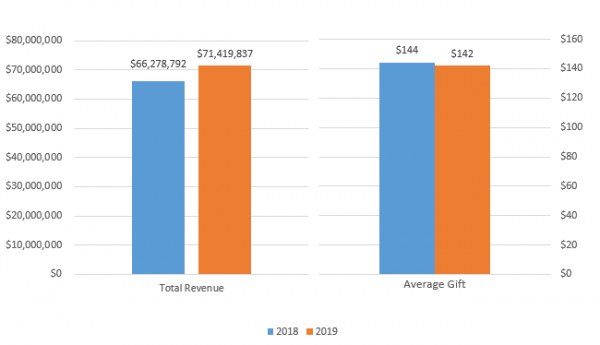
The majority of groups in our comparison report that the final email they sent in the series performed the best, while another quarter of participants report the very first message they sent performed the best. Regardless of when you sent your messages, the proof is in the pudding: 53% of revenue from Giving Tuesday can be directly attributed to email, with Facebook Fundraisers and SMS also bringing in sizeable chunks of revenue as well. When we include Facebook Fundraiser revenue, the 16 groups we have data for raised $7.1 million dollars on and around* Giving Tuesday—a 37% increase over 2018.
*that includes emails and promotions that may have launched in advance of or extended the deadline beyond that one special day, December 3rd, but that were still using the hook of Giving Tuesday to generate response.
So where do we go from here?
In case you had not heard, there’s a big election coming up this year—which means that the competition for attention, clicks, and dollars will be intense. Learning the right lessons from end-of-year can help you keep pushing, growing, and thriving—even when the going gets tough.
We want to hear from you! What are your concerns for the year ahead? What channels and tactics are you the most excited about? Comment below or @ us on social @mrcampaigns.
—————
When Karen isn’t dreaming up tests to improve fundraising, analyzing data, or playing with Google Analytics, she’s singing with 160 of her closest friends in the Choral Arts Society of Washington. You can reach her at khopper@mrss.com.
Does this mean that attribution may be overplayed in the non-profit space as compared to the for-profit space?
“Click-through gifts rose from 60% of all conversions in 2018 to 70% in 2019. That means that while the number of platforms is diversifying and organizations are testing more, most organizations are concentrating even more on platforms that drive immediate click-through gifts (e.g. Facebook/Instagram and Google Paid Search over Display). “
I agree with that. Email is still important because people are always using the internet nowadays. They spend their time to use internet mostly. Thank you so much for sharing this. This is very helpful to us. You are the best!!